
Introduction
This article describes how to create a beautiful ggplot Venn diagram. There are multiple extensions of the ggplot2 R package for creating Venn diagram in R, including the ggvenn and the ggVennDiagram packages.
The two packages enable to create Venn plots with 2 to 4 sets or dimensions. The main difference between the two packages is that the ggvenn package assigns a specific color to each set. The ggVennDiagram package maps the fill color of each region to quantity, allowing us to visually observe the differences between different parts.
You will learn how to create Venn diagrams in R using both ggvenn and ggVennDiagram functions.
Contents:
Create a demo data
set.seed(20190708)
genes <- paste("gene",1:1000,sep="")
x <- list(
  A = sample(genes,300),
  B = sample(genes,525),
  C = sample(genes,440),
  D = sample(genes,350)
  )
Create Venn diagrams using the ggVennDiagram R package
Install and load the ggVennDiagram package
Install the latest development version:
if (!require(devtools)) install.packages("devtools")
devtools::install_github("gaospecial/ggVennDiagram")
Load:
library("ggVennDiagram")Four dimension Venn plot
library("ggVennDiagram")
# Default plot
ggVennDiagram(x)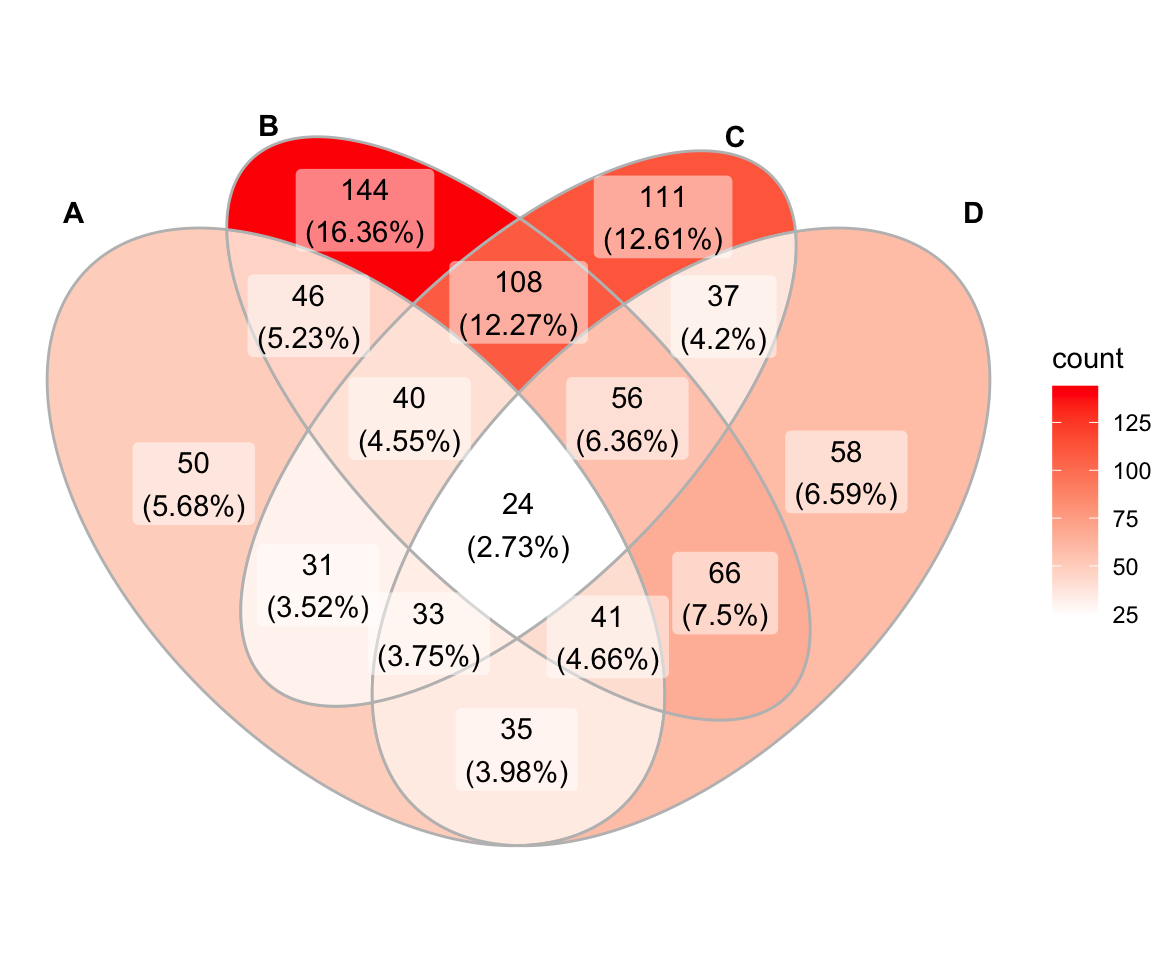
# Remove labels background color
ggVennDiagram(x, label_alpha = 0)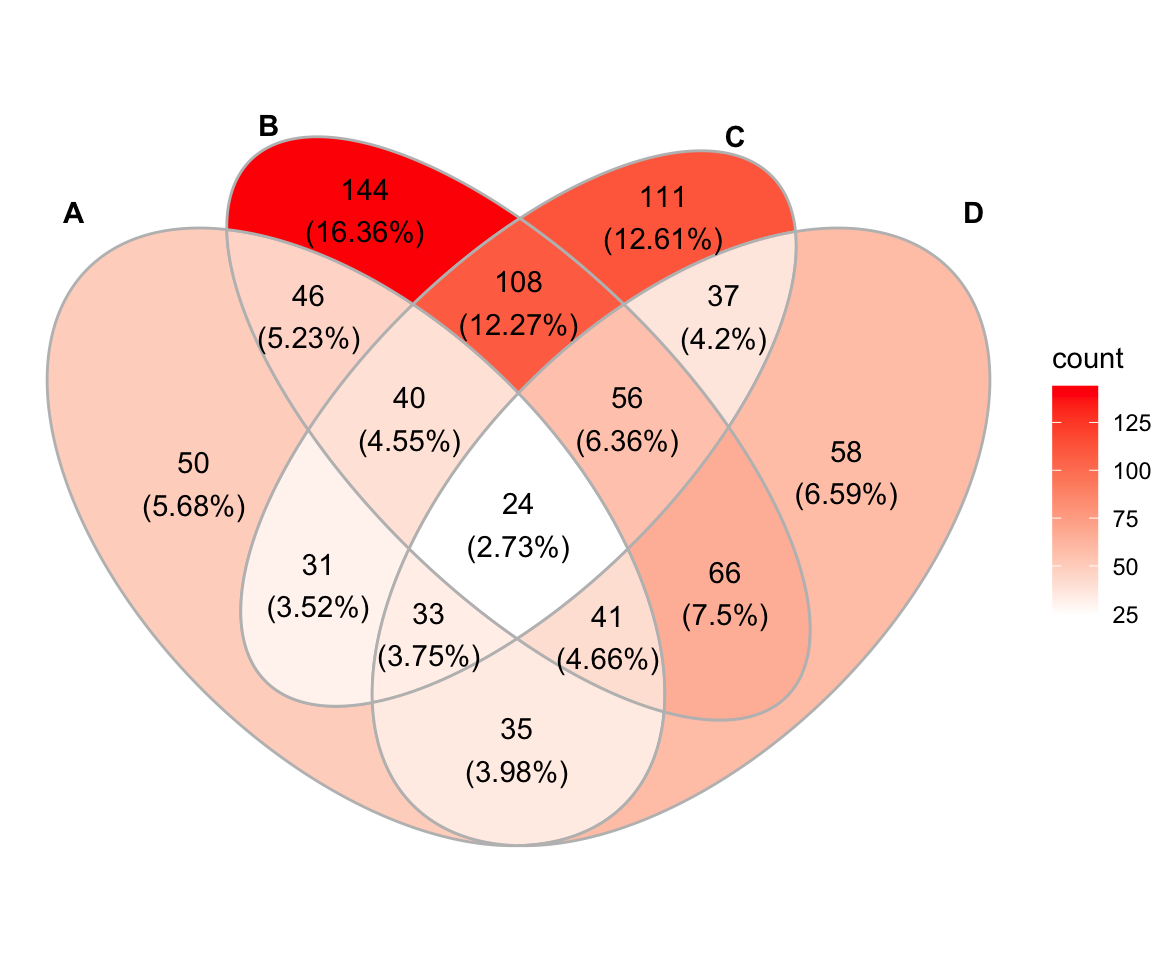
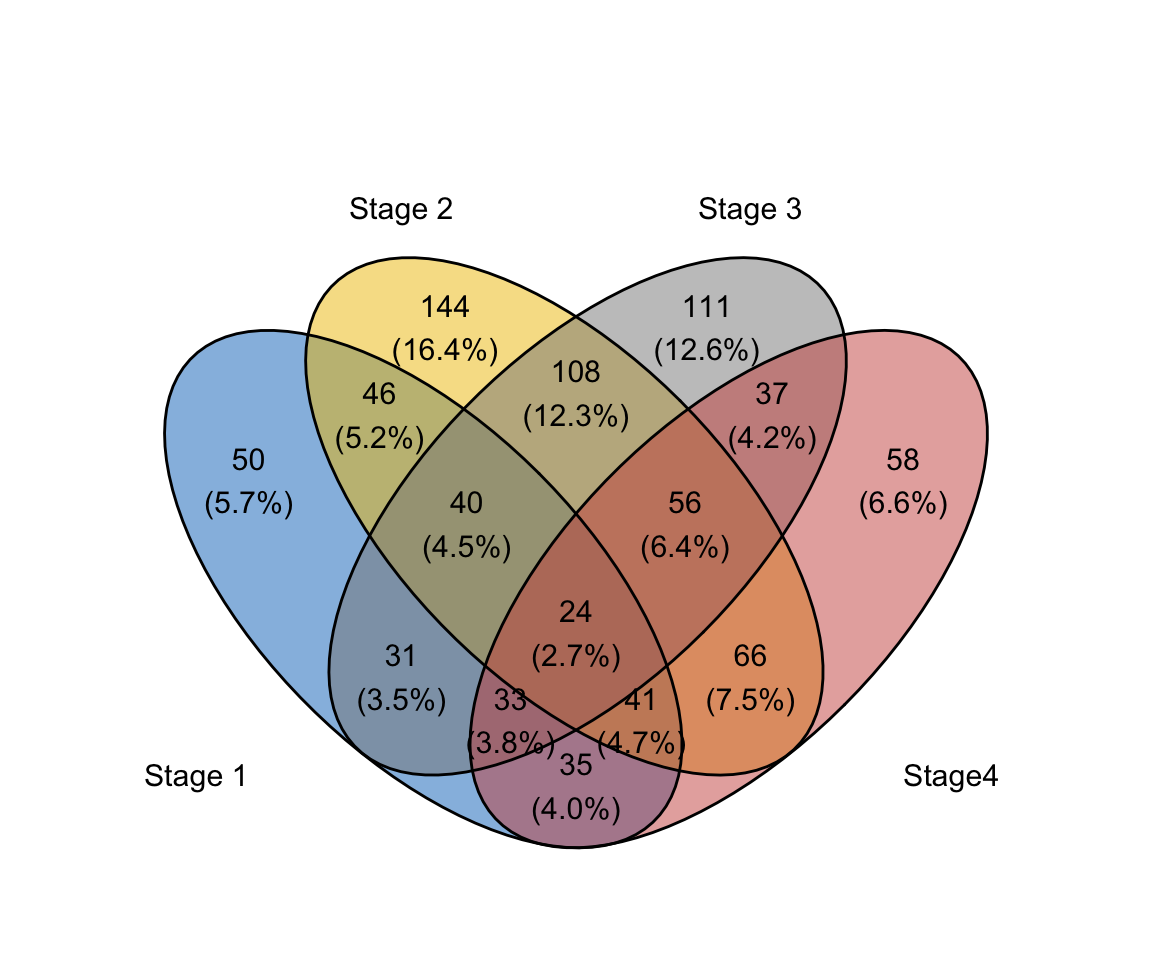
# Change category names
# Change the gradient fill color
ggVennDiagram(
  x, label_alpha = 0,
  category.names = c("Stage 1","Stage 2","Stage 3", "Stage4")
  ) +
  ggplot2::scale_fill_gradient(low="blue",high = "yellow")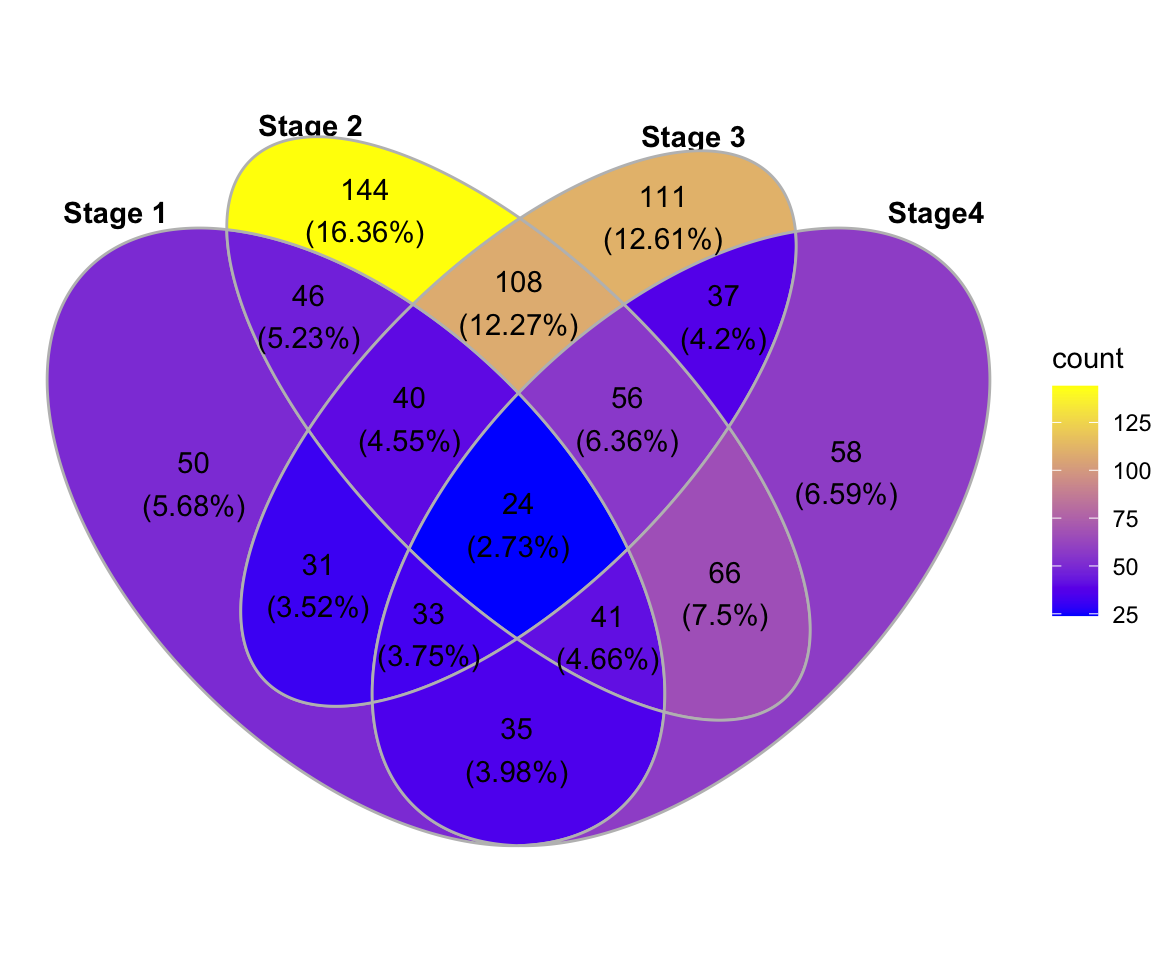
Three dimension Venn plot
ggVennDiagram(x[1:3], label_alpha = 0)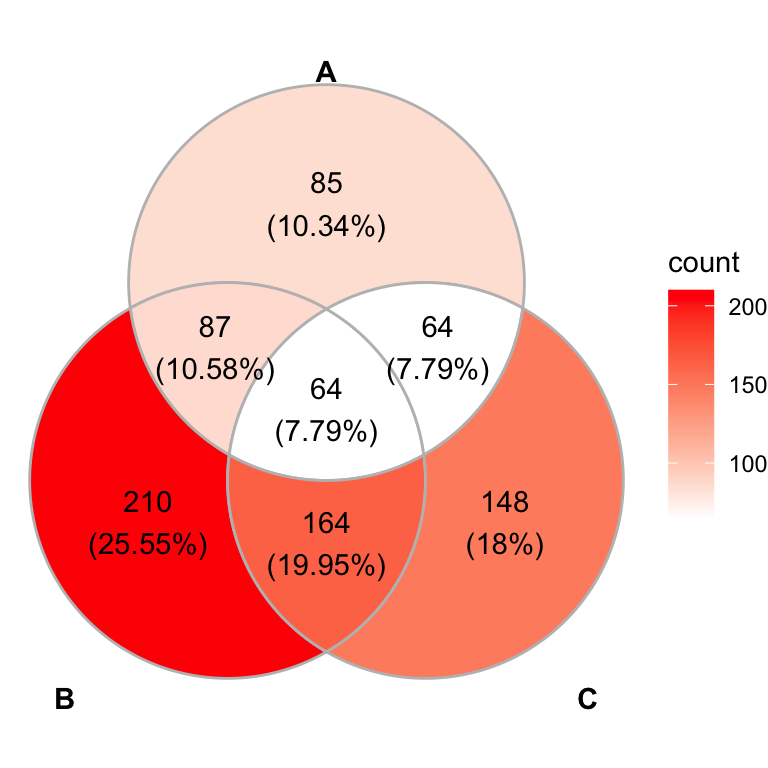
Two dimension Venn plot
ggVennDiagram(x[1:2], label_alpha = 0)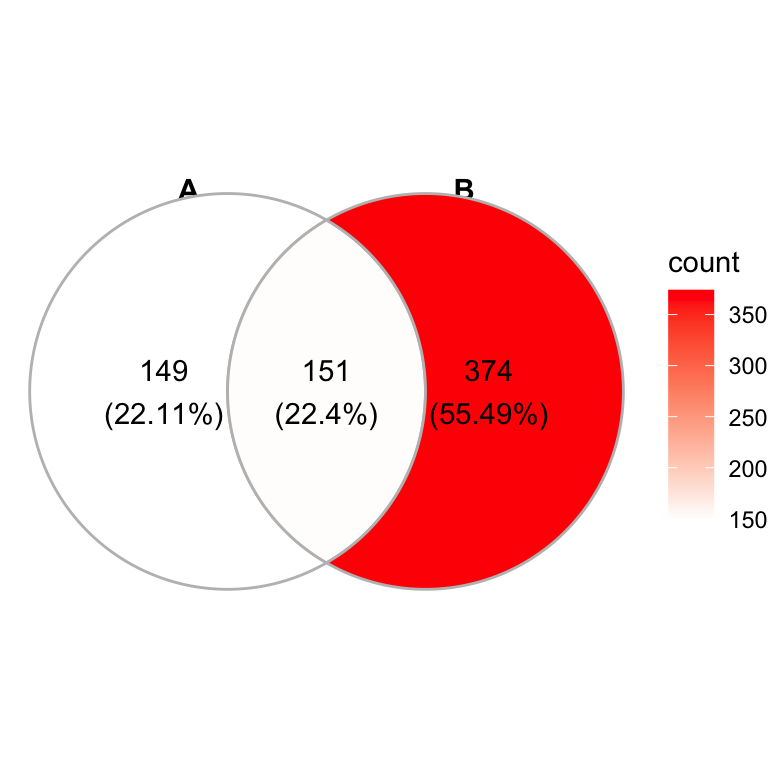
Create Venn diagrams using the ggven R package
Install and load the ggvenn package
Install the latest development version:
if (!require(devtools)) install.packages("devtools")
devtools::install_github("yanlinlin82/ggvenn")
Load:
library("ggvenn")Four dimension Venn plot
Note that, the ggvenn() function assigns a specific color to each set.
library("ggvenn")
# Default plot
ggvenn(x)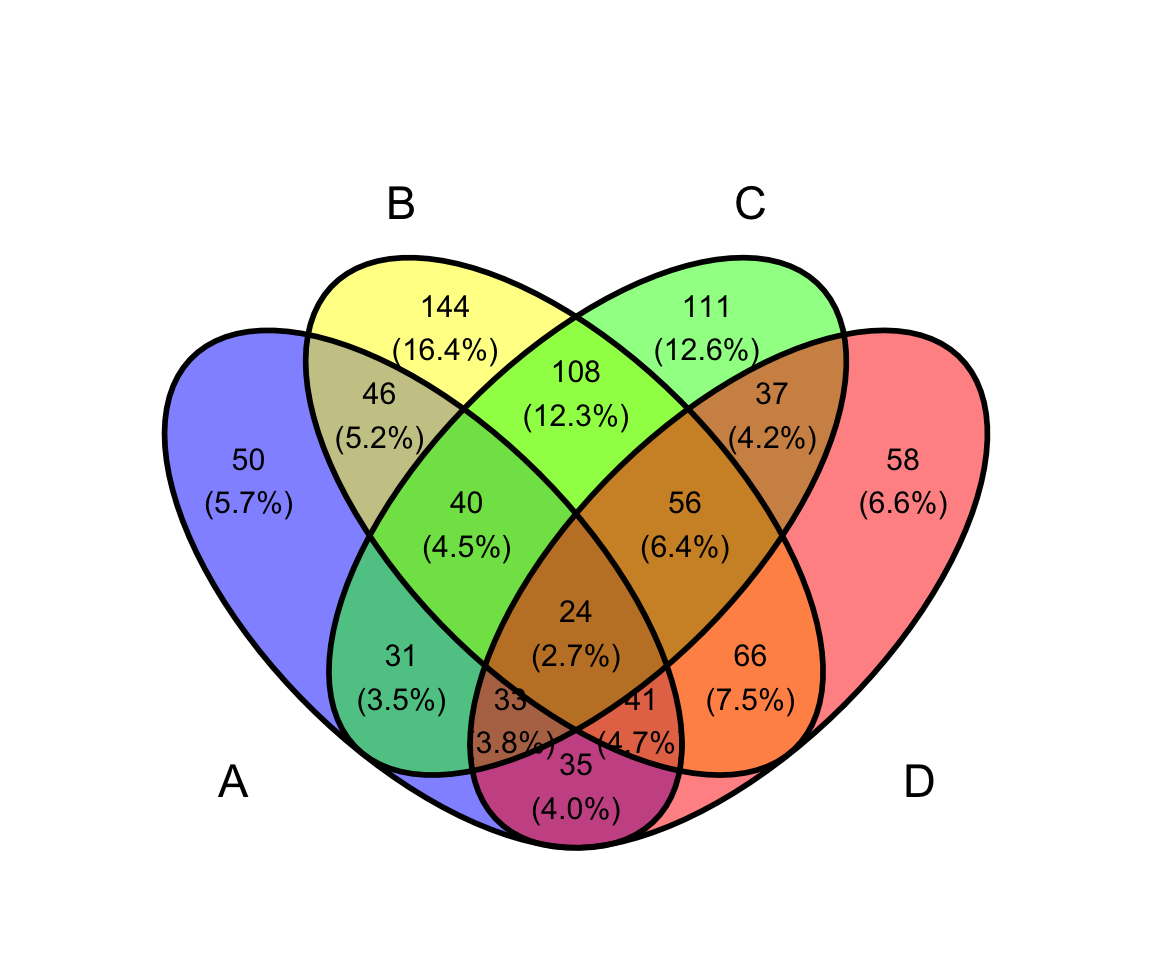
# Change category names
# Change the fill color
names(x) <- c("Stage 1","Stage 2","Stage 3", "Stage4")
ggvenn(
  x,
  fill_color = c("#0073C2FF", "#EFC000FF", "#868686FF", "#CD534CFF"),
  stroke_size = 0.5, set_name_size = 4
  )
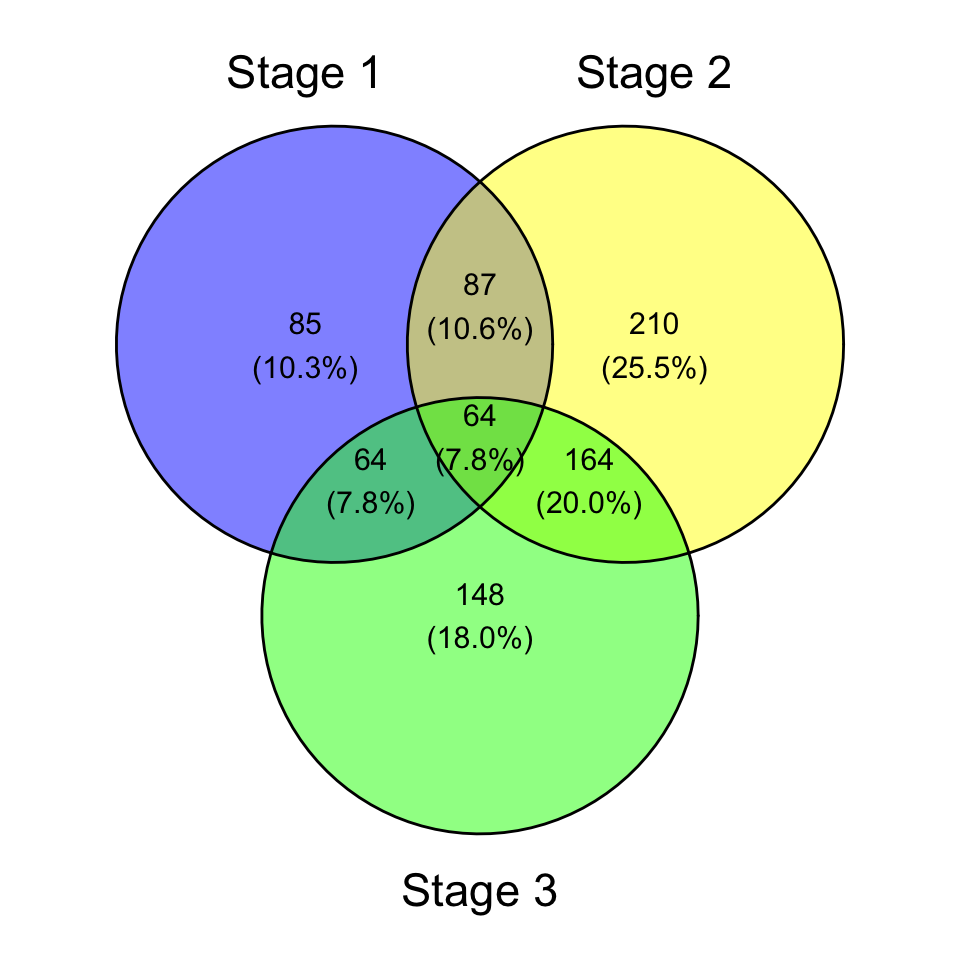
Three dimension Venn plot
ggvenn(
  x, columns = c("Stage 1", "Stage 2", "Stage 3"),
  stroke_size = 0.5
  )
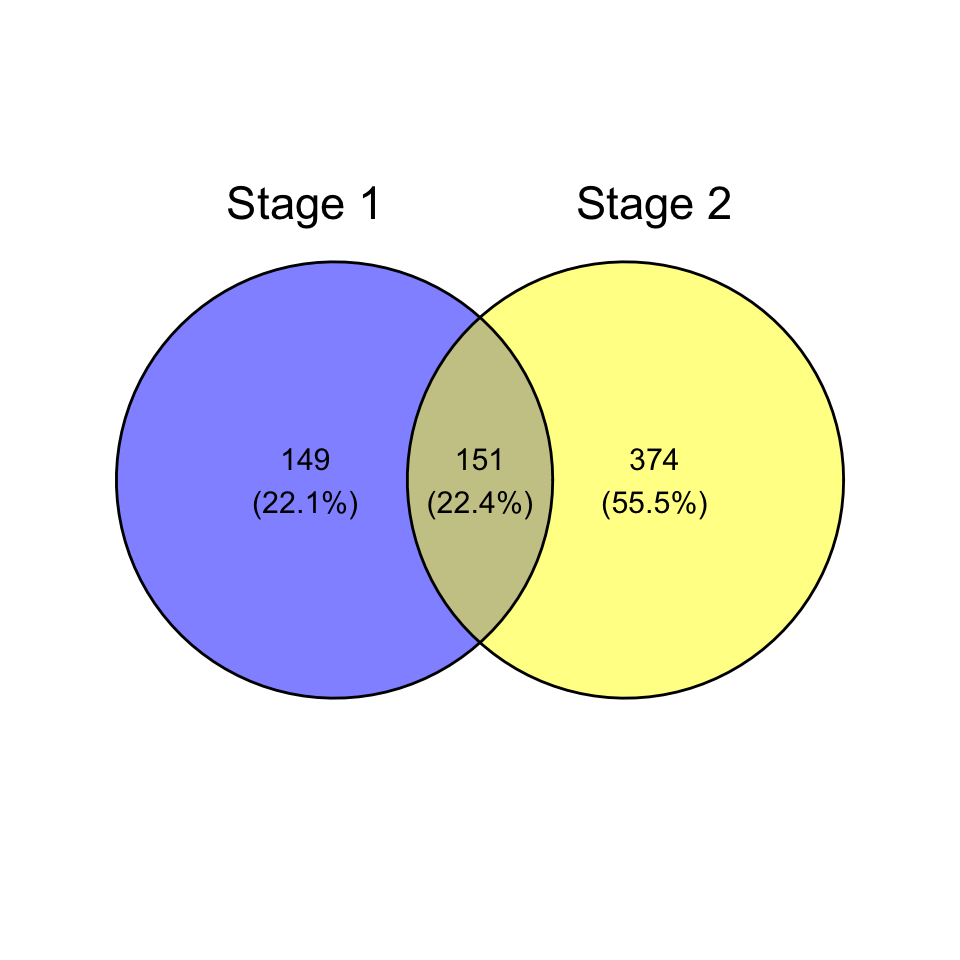
Two dimension Venn plot
ggvenn(
  x, columns = c("Stage 1", "Stage 2"),
  stroke_size = 0.5
  )
Conclusion
This article describes how to create a ggplot Venn diagram using the ggvernand the ggVennDiagram R packages.
Recommended for you
This section contains best data science and self-development resources to help you on your path.
Coursera - Online Courses and Specialization
Data science
- Course: Machine Learning: Master the Fundamentals by Stanford
- Specialization: Data Science by Johns Hopkins University
- Specialization: Python for Everybody by University of Michigan
- Courses: Build Skills for a Top Job in any Industry by Coursera
- Specialization: Master Machine Learning Fundamentals by University of Washington
- Specialization: Statistics with R by Duke University
- Specialization: Software Development in R by Johns Hopkins University
- Specialization: Genomic Data Science by Johns Hopkins University
Popular Courses Launched in 2020
- Google IT Automation with Python by Google
- AI for Medicine by deeplearning.ai
- Epidemiology in Public Health Practice by Johns Hopkins University
- AWS Fundamentals by Amazon Web Services
Trending Courses
- The Science of Well-Being by Yale University
- Google IT Support Professional by Google
- Python for Everybody by University of Michigan
- IBM Data Science Professional Certificate by IBM
- Business Foundations by University of Pennsylvania
- Introduction to Psychology by Yale University
- Excel Skills for Business by Macquarie University
- Psychological First Aid by Johns Hopkins University
- Graphic Design by Cal Arts
Amazon FBA
Amazing Selling Machine
Books - Data Science
Our Books
- Practical Guide to Cluster Analysis in R by A. Kassambara (Datanovia)
- Practical Guide To Principal Component Methods in R by A. Kassambara (Datanovia)
- Machine Learning Essentials: Practical Guide in R by A. Kassambara (Datanovia)
- R Graphics Essentials for Great Data Visualization by A. Kassambara (Datanovia)
- GGPlot2 Essentials for Great Data Visualization in R by A. Kassambara (Datanovia)
- Network Analysis and Visualization in R by A. Kassambara (Datanovia)
- Practical Statistics in R for Comparing Groups: Numerical Variables by A. Kassambara (Datanovia)
- Inter-Rater Reliability Essentials: Practical Guide in R by A. Kassambara (Datanovia)
Others
- R for Data Science: Import, Tidy, Transform, Visualize, and Model Data by Hadley Wickham & Garrett Grolemund
- Hands-On Machine Learning with Scikit-Learn, Keras, and TensorFlow: Concepts, Tools, and Techniques to Build Intelligent Systems by Aurelien Géron
- Practical Statistics for Data Scientists: 50 Essential Concepts by Peter Bruce & Andrew Bruce
- Hands-On Programming with R: Write Your Own Functions And Simulations by Garrett Grolemund & Hadley Wickham
- An Introduction to Statistical Learning: with Applications in R by Gareth James et al.
- Deep Learning with R by François Chollet & J.J. Allaire
- Deep Learning with Python by François Chollet
Version:
 Français


Hello,
Using ggvenn I wanted to list out items in the shared cells.
Example, Stage1 and 2 share 151 items. How can extract these 151 items and track them in my data frame?
Thanks