summary(cars) speed dist
Min. : 4.0 Min. : 2.00
1st Qu.:12.0 1st Qu.: 26.00
Median :15.0 Median : 36.00
Mean :15.4 Mean : 42.98
3rd Qu.:19.0 3rd Qu.: 56.00
Max. :25.0 Max. :120.00 This R Markdown document provides a simple demonstration of using code, text, and visualizations together to create an interactive report.
cars DatasetThe cars dataset in R contains speed and stopping distance data from the 1920s. Here is a summary of the data:
summary(cars) speed dist
Min. : 4.0 Min. : 2.00
1st Qu.:12.0 1st Qu.: 26.00
Median :15.0 Median : 36.00
Mean :15.4 Mean : 42.98
3rd Qu.:19.0 3rd Qu.: 56.00
Max. :25.0 Max. :120.00 Let’s create a scatter plot to visualize the relationship between speed and stopping distance:
plot(cars$speed, cars$dist,
     xlab = "Speed (mph)",
     ylab = "Stopping Distance (ft)",
     main = "Speed vs. Stopping Distance")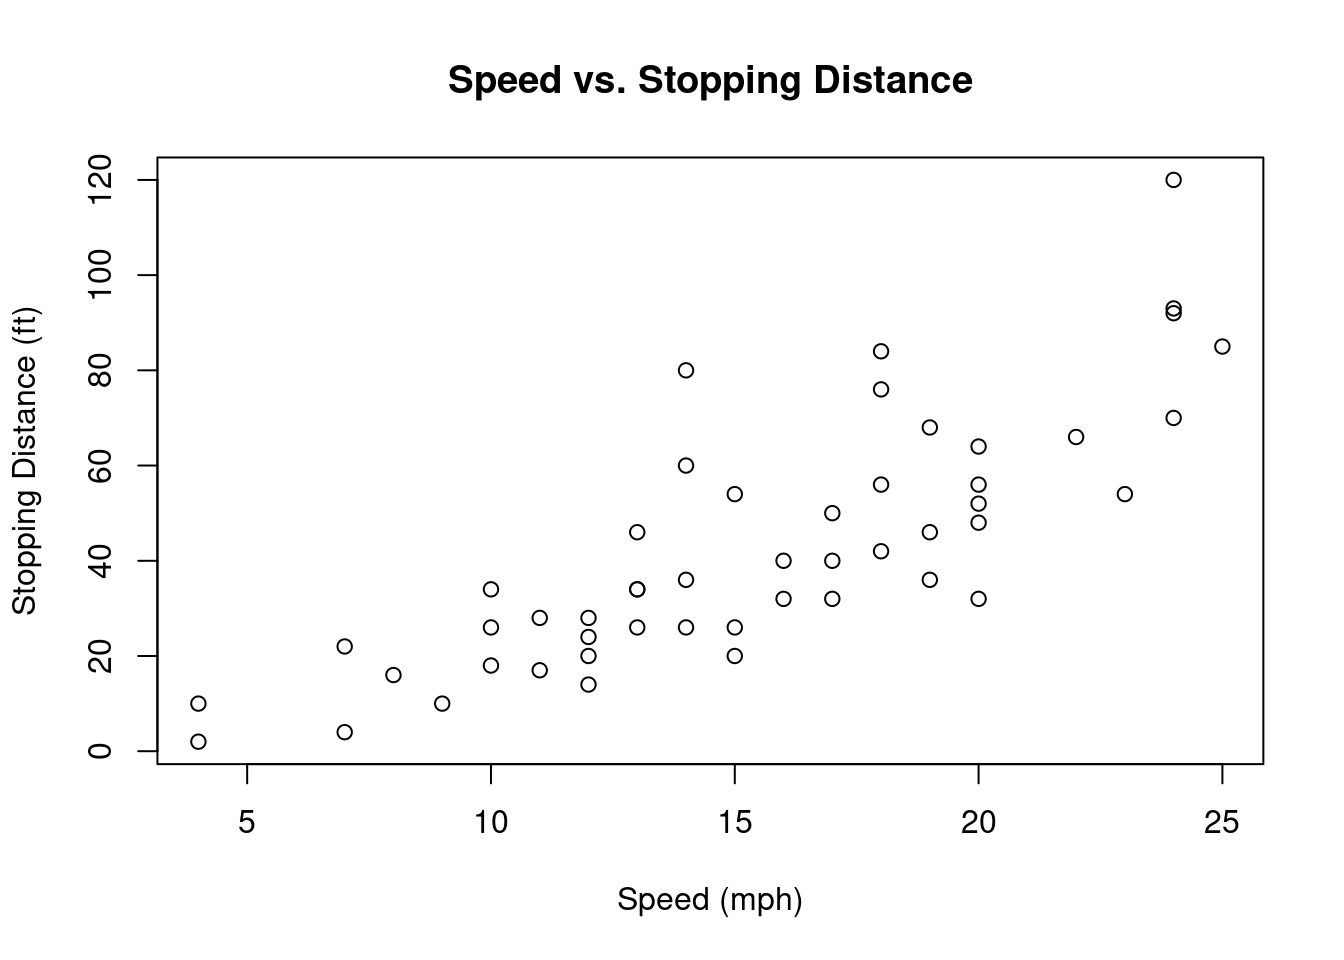
This is a simple example of how you can use R Markdown to create informative and visually appealing reports. You can mix text, R code, and visualizations to produce dynamic content.
Feel free to add more sections, analyses, or visualizations as you continue to explore the power of R Markdown!