Description
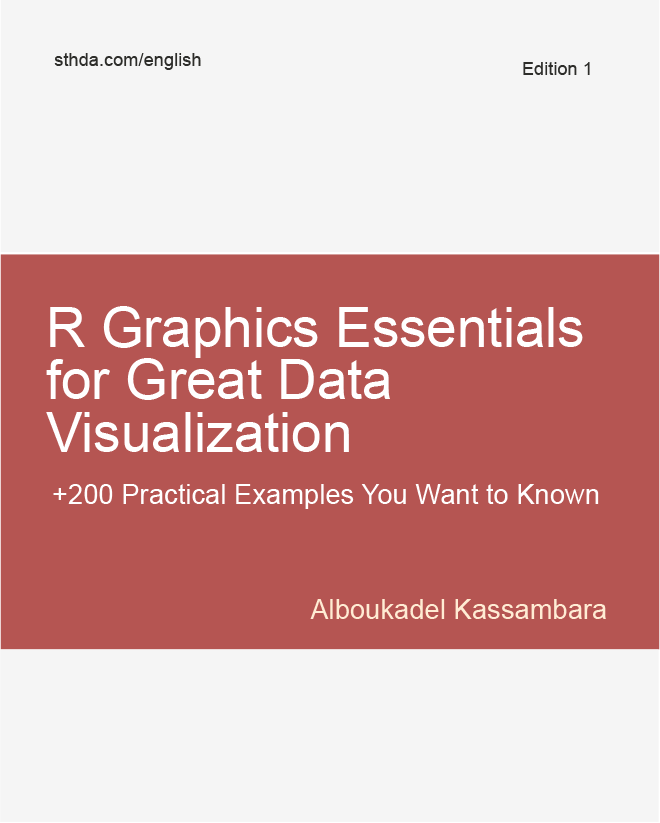
Data visualization is one of the most important part of data science. Many books and courses present a catalogue of graphics but they don't teach you which charts to use according to the type of the data.
In this book, we start by presenting the key graphic systems and packages available in R, including R base graphs, lattice and ggplot2 plotting systems.
Next, we provide practical examples to create great graphics for the right data using either the ggplot2 package and extensions or the traditional R graphics.
With this book, you 'll learn:
- How to quickly create beautiful graphics using ggplot2 packages
- How to properly customize and annotate the plots
- Type of graphics for visualizing categorical and continuous variables
- How to add automatically p-values to box plots, bar plots and alternatives
- How to add marginal density plots and correlation coefficients to scatter plots
- Key methods for analyzing and visualizing multivariate data
- R functions and packages for plotting time series data
- How to combine multiple plots on one page to create production-quality figures.
Version:
English


Pearson (client confirmé) –
I love this book! It contains many examples to create beautiful graphs using the ggplot2 R package. Must read!
Ilya B. (client confirmé) –
Excellent book, helped me a lot to start work with R
Eko Subagyo (client confirmé) –
Eugen Malamutmann (client confirmé) –
Anonymous (client confirmé) –
Johann (client confirmé) –
A good set of graphic tools in science is essential to convey concepts and conclusions, particularly to an audience of non-scientists. The book contains a comprehensive set of examples showing how to display univariate and bivariate statistical data, including how to zoom in to a portion of a scatter plot, which I have not yet come across in R code. Any reader who frequently needs to graphically display data, or who is looking for new ways to spice up their graphs, will find this book valuable. A great reference to have.
Mahmood Soofi (client confirmé) –
Modeste M. (client confirmé) –
Very interesting book. It provides practical examples to create great graphics using either the ggplot2 package and extensions or the traditional R graphics. I recommend it.
Etoma Egot (client confirmé) –
This was my first purchase and it definitely was a fantastic experience. I received the download link almost immediately and the contents of the book are just as described in the preview. I strongly recommend Datanovia services
Jahn Davik (client confirmé) –
Anonymous (client confirmé) –
Excelent book!
Anonymous (client confirmé) –
Very good to quickly get you going in ggplot/ggpubr
Ioannis M. (client confirmé) –
Great reference guide and application ready with good examples.
PEDRO N. (client confirmé) –
Excellent book with very good content, clearly and easily addresses the creation of graphics with R. Thanks
Anonymous (client confirmé) –
Etienne Ntumba (client confirmé) –
Anonymous (client confirmé) –
Very nice for a quick short introduction of many different Graph types
Jose Rafael Herrera Herrera (client confirmé) –
The book is very easy to understand and has plenty of examples on how to design different types of graphs. The description and examples of the book in the Datanovia web page was very important to decide this purchase. Both the purchase and downloading processes on the Datanovia web page were secure and easy.
Christopher Chitemerere (client confirmé) –
Excellent book
Anonymous (client confirmé) –