The xlsx Package in R: Format, Style, and Build Rich Excel Reports
The Java-based toolkit for cell styles, titles, formatted tables, embedded plots, and multi-sheet reports
A reference guide to the R xlsx package — the Java-based toolkit for the rich, cell-level Excel formatting that writexl and openxlsx don’t do as easily: titles and subtitles, cell styles, formatted tables, embedded plots, hyperlinks, and multi-sheet reports. Includes the r2excel helper that wraps it all into one-liners. For everyday Java-free read/write, the modern lessons are cross-linked.
- Read and write Excel sheets with the
xlsxpackage (the basics — briefly, then we cross-link the modern route). - Write several datasets into one workbook in a single call.
- The real reason to reach for
xlsx: rich cell-level formatting — titles and subtitles, cell styles, formatted tables, embedded plots, and multi-sheet reports. - The
r2excelhelper that collapses all that hard-coding into one-liners (xlsx.addHeader,xlsx.addTable,xlsx.addPlot,xlsx.addHyperlink).
Most of the time, all you want is to get a data frame into or out of an .xlsx file — and for that the modern, Java-free packages are the right tool (we cover them in the linked lessons below). But every so often you need to hand a client or a colleague a formatted Excel report: a titled sheet, a styled header row, a table with borders, a plot dropped in beside it. That is exactly where the xlsx package still earns its place.
xlsx is a full-featured R package to read, write, and — the part that sets it apart — format Excel files with control right down to the individual cell. It handles both the legacy .xls and the modern .xlsx formats.
One honest caveat: it needs Java
xlsx is a Java-based package. It depends on rJava and xlsxjars, which means you need a working Java installation on your machine for it to load. That is the trade-off for its formatting power, and it is the reason it does not run in a browser sandbox or a lean, Java-free environment.
So here is the honest positioning:
- For everyday, Java-free read/write — importing a sheet into a data frame, or exporting one back out — reach for the modern packages
readxl,writexl, andopenxlsx. They have no external dependency and they are fast. See the step-by-step lessons: Read Excel Files in R and Write Excel Files in R. - For rich, cell-level formatting — styled titles, bordered tables, embedded plots, multi-sheet reports —
xlsx(and ther2excelhelper below) still does things those packages don’t do as easily. That is what this reference is about.
This is a static reference: the code below is copy-paste-ready to run in your own R session (with Java installed), but there is no live in-browser sandbox on this page — xlsx needs Java, which a browser runtime can’t provide. Each result is shown as a screenshot of the Excel file it produces.
Install and load the xlsx package
Install once, then load it in each session:
install.packages("xlsx")
library("xlsx")
Note that xlsx pulls in the rJava and xlsxjars packages. If installation fails, the fix is almost always a missing or mismatched Java runtime — install a JDK and, on some systems, run R CMD javareconf before retrying.
Read an Excel file (the basics)
Two functions read a worksheet into a data frame:
read.xlsx(file, sheetIndex, header = TRUE, colClasses = NA)
read.xlsx2(file, sheetIndex, header = TRUE, colClasses = "character")read.xlsxpreserves data types — it tries to guess the class of each column. It is convenient but slow on large sheets (more than ~100,000 cells).read.xlsx2is much faster on big files but is less clever about column types.
A quick example, reading the first sheet of a file that ships with the package:
library(xlsx)
file <- system.file("tests", "test_import.xlsx", package = "xlsx")
res  <- read.xlsx(file, sheetIndex = 1)   # read the first sheet
head(res[, 1:6])
Both functions read .xls and .xlsx. For the modern, Java-free way to read — including reading a specific sheet, a cell range, or setting column types — see the full lesson Read Excel Files in R.
Write data to an Excel file (the basics)
The mirror image is write.xlsx() (and the faster write.xlsx2() for very large data frames):
write.xlsx(x, file, sheetName = "Sheet1",
           col.names = TRUE, row.names = TRUE, append = FALSE)
Export a data frame in one line:
library(xlsx)
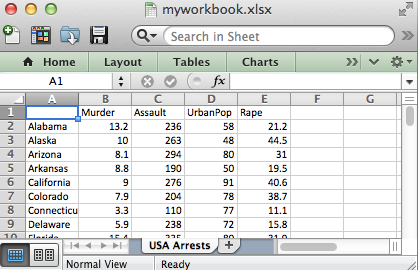
write.xlsx(USArrests, file = "myworkbook.xlsx", sheetName = "USA Arrests")
The file lands in your current working directory:
For the modern, Java-free write route — a single sheet, several named sheets from a list, and basic styling with openxlsx — see Write Excel Files in R.
Add several sheets by appending
To put more than one dataset in the same workbook, set append = TRUE on each write after the first. Each call adds a new worksheet:
# First data set → a new workbook
write.xlsx(USArrests, file = "myworkbook.xlsx",
           sheetName = "USA-ARRESTS", append = FALSE)
# Second data set → a new worksheet
write.xlsx(mtcars, file = "myworkbook.xlsx",
           sheetName = "MTCARS", append = TRUE)
# Third data set
write.xlsx(Titanic, file = "myworkbook.xlsx",
           sheetName = "TITANIC", append = TRUE)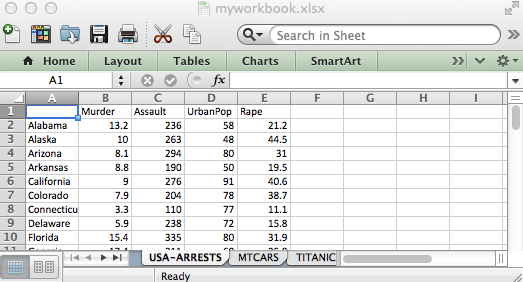
It works, but it is repetitive. The next section wraps it into one call.
Write several datasets in a single call
Here is a small helper — xlsx.writeMultipleData() — that exports any number of R objects to one workbook, using each object’s name as the sheet name. Copy it into your session:
#+++++++++++++++++++++++++++
# xlsx.writeMultipleData
#+++++++++++++++++++++++++++
# file : the path to the output file
# ...  : a list of data to write to the workbook
xlsx.writeMultipleData <- function(file, ...) {
  require(xlsx, quietly = TRUE)
  objects   <- list(...)
  fargs     <- as.list(match.call(expand.dots = TRUE))
  objnames  <- as.character(fargs)[-c(1, 2)]
  nobjects  <- length(objects)
  for (i in 1:nobjects) {
    if (i == 1)
      write.xlsx(objects[[i]], file, sheetName = objnames[i])
    else
      write.xlsx(objects[[i]], file, sheetName = objnames[i], append = TRUE)
  }
}
It handles data frames, matrices, time series, and tables. Give it a file name and the objects:
xlsx.writeMultipleData("myworkbook.xlsx",
                       mtcars, Titanic, AirPassengers, state.x77)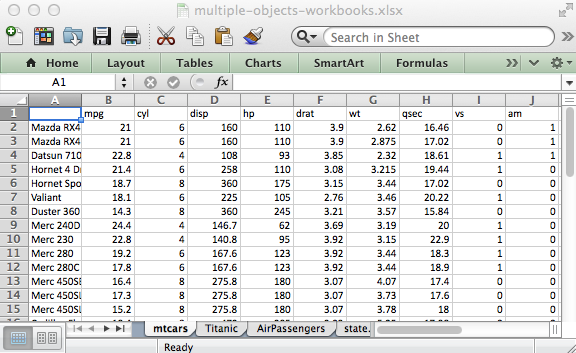
The four sheets are named after the objects — mtcars (a data frame), Titanic (a table), AirPassengers (a time series), and state.x77 (a matrix).
The real power: build a formatted Excel report
write.xlsx() is fine when you just want a data frame in a sheet. But xlsx can build a genuinely nice report — a titled sheet, a styled and bordered table, a plot embedded on its own tab. The trade-off is verbosity: this takes some hard-coding. The workflow is five steps:
- Create a workbook.
- Define cell styles — fonts, colours, alignment, borders.
- Write titles, a table, and a plot into a sheet using those styles.
- Save the workbook.
- Open it in Excel.
The screenshots below use the built-in state.x77 matrix (facts about the 50 US states) purely as illustrative data.
Step 1 — Create a workbook
library(xlsx)
# type can be "xls" or "xlsx"
wb <- createWorkbook(type = "xlsx")
Step 2 — Define cell styles
CellStyle() builds a style you can attach to any cell; you compose it with Font(), Alignment(), and Border() using +. Here we define a bold blue title, an italic subtitle, and a bold, centred, bordered header row for the table:
# Title and subtitle styles
TITLE_STYLE     <- CellStyle(wb) + Font(wb, heightInPoints = 16,
                                        color = "blue", isBold = TRUE, underline = 1)
SUB_TITLE_STYLE <- CellStyle(wb) + Font(wb, heightInPoints = 14,
                                        isItalic = TRUE, isBold = FALSE)

# Styles for the data-table row and column names
TABLE_ROWNAMES_STYLE <- CellStyle(wb) + Font(wb, isBold = TRUE)
TABLE_COLNAMES_STYLE <- CellStyle(wb) + Font(wb, isBold = TRUE) +
  Alignment(wrapText = TRUE, horizontal = "ALIGN_CENTER") +
  Border(color = "black", position = c("TOP", "BOTTOM"),
         pen = c("BORDER_THIN", "BORDER_THICK"))
The building blocks:
Font()—color,heightInPoints(font size),isBold,isItalic,underline(0, 1, or 2), andnamefor the typeface.Alignment()—wrapText,horizontal("ALIGN_CENTER","ALIGN_LEFT","ALIGN_RIGHT","ALIGN_JUSTIFY"),vertical, androtationin degrees.Border()—color,position("TOP","BOTTOM","LEFT","RIGHT"), andpen(line style, e.g."BORDER_THIN","BORDER_THICK","BORDER_DASHED").
Step 3 — Add a sheet, titles, a table, and a plot
First, a sheet and a small helper that writes a title into a given row (create a row → create a cell → set its value → set its style):
# A new sheet in the workbook
sheet <- createSheet(wb, sheetName = "US State Facts")

#++++++++++++++++++++++++
# Helper: add a titled row
#++++++++++++++++++++++++
xlsx.addTitle <- function(sheet, rowIndex, title, titleStyle) {
  rows       <- createRow(sheet, rowIndex = rowIndex)
  sheetTitle <- createCell(rows, colIndex = 1)
  setCellValue(sheetTitle[[1, 1]], title)
  setCellStyle(sheetTitle[[1, 1]], titleStyle)
}

# Title and subtitle
xlsx.addTitle(sheet, rowIndex = 1, title = "US State Facts",
              titleStyle = TITLE_STYLE)
xlsx.addTitle(sheet, rowIndex = 2,
              title = "Data sets related to the 50 states of USA.",
              titleStyle = SUB_TITLE_STYLE)
Add the table with addDataFrame(), applying the header and row-name styles from Step 2, then widen the columns so the numbers breathe:
addDataFrame(state.x77, sheet, startRow = 3, startColumn = 1,
             colnamesStyle = TABLE_COLNAMES_STYLE,
             rownamesStyle = TABLE_ROWNAMES_STYLE)
setColumnWidth(sheet, colIndex = 1:ncol(state.x77), colWidth = 11)
To embed a plot, save it to a PNG first, create a sheet for it, then place it with addPicture():
# Create a PNG plot on disk
png("boxplot.png", height = 800, width = 800, res = 250, pointsize = 8)
boxplot(count ~ spray, data = InsectSprays, col = "blue")
dev.off()

# A sheet to hold the plot, with a title
sheet <- createSheet(wb, sheetName = "boxplot")
xlsx.addTitle(sheet, rowIndex = 1,
              title = "Box plot using InsectSprays data",
              titleStyle = TITLE_STYLE)

# Drop the image in, then clean up the temporary file
addPicture("boxplot.png", sheet, scale = 1, startRow = 4, startColumn = 1)
file.remove("boxplot.png")
Step 4 — Save the workbook
saveWorkbook(wb, "r-xlsx-report-example.xlsx")Step 5 — Open and view it
Open the file from your working directory. The formatted table sheet and the embedded-plot sheet look like this:
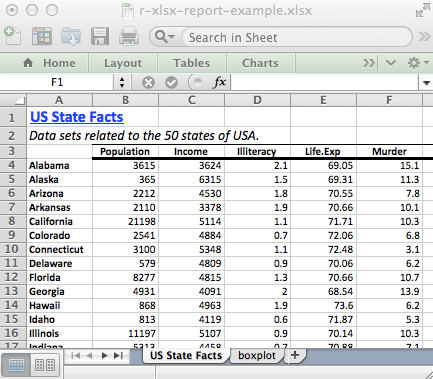
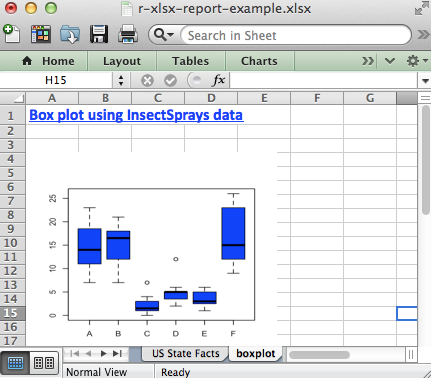
That is the full formatting toolkit — styles, titles, bordered tables, embedded plots, multiple sheets — all driven from R. It does the whole job, but as you can see it takes a lot of code. The next section fixes that.
r2excel: the same reports in one-liners
Because formatting with raw xlsx means so much hard-coding, we wrote r2excel — a convenience wrapper on top of xlsx that turns each of those multi-line recipes into a single, readable function call. It is one of our own open-source packages, and like xlsx it is Java-based (it depends on xlsx, so the same Java requirement applies).
Install it from GitHub:
install.packages("devtools")
devtools::install_github("kassambara/r2excel")
library(r2excel)
The helpers mirror the report-building steps above, one function each:
xlsx.addHeader()— a styled header/title.xlsx.addParagraph()— a block of text.xlsx.addTable()— a formatted data frame.xlsx.addPlot()— a plot, no manual PNG round-trip.xlsx.addHyperlink()— a clickable link.xlsx.addLineBreak()— blank rows between blocks.xlsx.readFile()/xlsx.writeFile()/xlsx.writeMultipleData()— read and write helpers.
Add headers
xlsx.addHeader() takes a level (1–6, like HTML headings), a color, and an underline (0, 1, or 2):
wb    <- createWorkbook(type = "xlsx")
sheet <- xlsx::createSheet(wb, sheetName = "example1")

xlsx.addHeader(wb, sheet, value = "Header 1", level = 1, color = "black")
xlsx.addHeader(wb, sheet, value = "Header 2", level = 2, color = "black")
xlsx.addHeader(wb, sheet, value = "Header 3", level = 3, color = "black")
xlsx.addHeader(wb, sheet, value = "Header 4", level = 4, color = "black")
xlsx.addHeader(wb, sheet, value = "Header 5", level = 5, color = "black")
xlsx.addHeader(wb, sheet, value = "Header 6", level = 6, color = "black")

saveWorkbook(wb, "examples_add_header.xlsx")
Add a paragraph of text
xlsx.addParagraph() writes a block of text with control over colour, size, style, and how many cells it spans:
wb    <- createWorkbook(type = "xlsx")
sheet <- createSheet(wb, sheetName = "example1")

xlsx.addHeader(wb, sheet, "Add paragraph", level = 2, underline = 1)
xlsx.addLineBreak(sheet, 2)
paragraph <- "Lorem Ipsum is simply dummy text of the printing and typesetting industry."
xlsx.addParagraph(wb, sheet, paragraph, fontSize = 14, isItalic = TRUE,
                  fontColor = "darkred", colSpan = 10, rowSpan = 10)

saveWorkbook(wb, "examples_add_paragraph.xlsx")
Add a hyperlink
wb    <- createWorkbook(type = "xlsx")
sheet <- createSheet(wb, sheetName = "example1")

xlsx.addHeader(wb, sheet, "Add hyperlink", level = 2, underline = 1)
xlsx.addLineBreak(sheet, 1)
xlsx.addHyperlink(wb, sheet, "https://www.datanovia.com", "Click me!", fontSize = 12)

saveWorkbook(wb, "examples_add_hyperlink.xlsx")
Add a formatted table
xlsx.addTable() writes a data frame with a styled header and optional zebra-striping via rowFill (the iris data here is illustrative):
wb    <- createWorkbook(type = "xlsx")
sheet <- createSheet(wb, sheetName = "example1")
data(iris)

# Default styling
xlsx.addHeader(wb, sheet, value = "Add iris table (default settings)")
xlsx.addLineBreak(sheet, 1)
xlsx.addTable(wb, sheet, head(iris))
xlsx.addLineBreak(sheet, 2)

# Customised: dark-blue text, alternating white / light-blue rows
xlsx.addHeader(wb, sheet, value = "Customized table")
xlsx.addLineBreak(sheet, 1)
xlsx.addTable(wb, sheet, data = head(iris),
              fontColor = "darkblue", fontSize = 14,
              rowFill = c("white", "lightblue"))

saveWorkbook(wb, "examples_add_table.xlsx")
Add a plot
xlsx.addPlot() takes a plotting function and embeds the result directly — no manual png()/dev.off():
wb    <- createWorkbook(type = "xlsx")
sheet <- createSheet(wb, sheetName = "example1")

# A base-R box plot
data(ToothGrowth)
xlsx.addHeader(wb, sheet, "Basic box plot")
xlsx.addLineBreak(sheet, 1)
xlsx.addPlot(wb, sheet, function() {
  boxplot(len ~ dose, data = ToothGrowth, col = 1:3)
})

# A ggplot2 plot
library(ggplot2)
xlsx.addHeader(wb, sheet, "ggplot2")
xlsx.addLineBreak(sheet, 1)
xlsx.addPlot(wb, sheet, function() {
  print(qplot(mpg, wt, data = mtcars))
})

saveWorkbook(wb, "examples_add_plot.xlsx")

Putting it together
Chaining those helpers — xlsx.addHeader(), xlsx.addTable(), xlsx.addParagraph(), xlsx.addPlot(), xlsx.addHyperlink(), then saveWorkbook() — builds a complete, formatted report in far less code than raw xlsx. Each helper writes onto the same sheet in sequence, so a title, a table, a note, and a chart stack into one polished workbook.
Which package should you use?
Keep it simple:
- Everyday read/write, no Java →
readxl/writexl/openxlsx. Fast, dependency-light, and covered step by step in Read Excel Files in R and Write Excel Files in R. - Rich formatting, and you have Java →
xlsxfor full cell-level control, orr2excelto get the same reports with far less code.
There is no single “best” package — it is a trade-off between the Java dependency and how much formatting control you need. If all you do is move data in and out, stay Java-free. If you regularly hand people formatted Excel reports from R, xlsx and r2excel are worth the Java setup.
Frequently asked questions
Use the xlsx package. Create a workbook with createWorkbook(), add a sheet with createSheet(), define styles with CellStyle() + Font()/Alignment()/Border(), then write a title into a cell, add a table with addDataFrame(), and embed a plot with addPicture() (after saving it as a PNG). Finally call saveWorkbook(). The r2excel helper collapses each of those into one call — xlsx.addHeader(), xlsx.addTable(), and xlsx.addPlot().
r2excel is a convenience wrapper on top of xlsx that turns its verbose formatting recipes into one-liners — xlsx.addHeader(), xlsx.addParagraph(), xlsx.addTable(), xlsx.addPlot(), and xlsx.addHyperlink(). Install it from GitHub with devtools::install_github("kassambara/r2excel"). Because it depends on xlsx, it is also Java-based.
Use openxlsx (or readxl/writexl) for everyday reading and writing — none of them need Java, and they are fast. Use xlsx when you need its rich cell-level formatting and are comfortable installing Java. In short: Java-free read/write → openxlsx; deep formatting with Java available → xlsx.
xlsx is built on Apache POI, a Java library for reading and writing Microsoft Office files, and it talks to it through the rJava bridge. That is why you need a working Java runtime installed for the package to load — and why it can’t run in a browser or a Java-free environment. The Java-free alternatives (readxl, writexl, openxlsx) avoid this entirely.
Call write.xlsx() once per dataset, passing append = TRUE on every call after the first, each with its own sheetName. To do it in a single call, use the xlsx.writeMultipleData() helper shown above (also available in r2excel), which names each sheet after the object you pass in.
Conclusion
The xlsx package is the Java-based workhorse for formatting Excel files from R — cell styles, titled sheets, bordered tables, embedded plots, and multi-sheet reports that writexl and openxlsx don’t produce as easily. The trade-off is the Java dependency and a fair amount of code; the r2excel helper removes most of the code. For plain, Java-free read and write, stay with the modern packages and the lessons linked below.
Citation
@online{kassambara2026,
  author = {Kassambara, Alboukadel},
  title = {The Xlsx {Package} in {R:} {Format,} {Style,} and {Build}
    {Rich} {Excel} {Reports}},
  date = {2026-07-10},
  url = {https://www.datanovia.com/blog/xlsx-package-in-r},
  langid = {en}
}