

Description
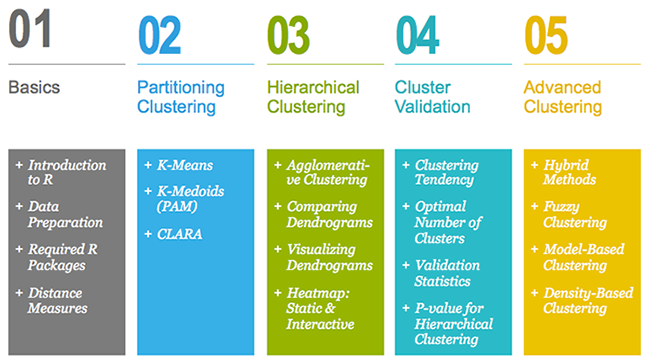
Although there are several good books on unsupervised machine learning, we felt that many of them are too theoretical. This book provides practical guide to cluster analysis, elegant visualization and interpretation. It contains 5 parts. Part I provides a quick introduction to R and presents required R packages, as well as, data formats and dissimilarity measures for cluster analysis and visualization. Part II covers partitioning clustering methods, which subdivide the data sets into a set of k groups, where k is the number of groups pre-specified by the analyst. Partitioning clustering approaches include: K-means, K-Medoids (PAM) and CLARA algorithms. In Part III, we consider hierarchical clustering method, which is an alternative approach to partitioning clustering. The result of hierarchical clustering is a tree-based representation of the objects called dendrogram. In this part, we describe how to compute, visualize, interpret and compare dendrograms. Part IV describes clustering validation and evaluation strategies, which consists of measuring the goodness of clustering results. Among the chapters covered here, there are: Assessing clustering tendency, Determining the optimal number of clusters, Cluster validation statistics, Choosing the best clustering algorithms and Computing p-value for hierarchical clustering. Part V presents advanced clustering methods, including: Hierarchical k-means clustering, Fuzzy clustering, Model-based clustering and Density-based clustering.
Introduction
Large amounts of data are collected every day from satellite images, bio-medical, security, marketing, web search, geo-spatial or other automatic equipment. Mining knowledge from these big data far exceeds human’s abilities.
Clustering is one of the important data mining methods for discovering knowledge in multidimensional data. The goal of clustering is to identify pattern or groups of similar objects within a data set of interest.
In the litterature, it is referred as “pattern recognition” or “unsupervised machine learning” - “unsupervised” because we are not guided by a priori ideas of which variables or samples belong in which clusters. “Learning” because the machine algorithm “learns” how to cluster.
Cluster analysis is popular in many fields, including:
- In cancer research for classifying patients into subgroups according their gene expression profile. This can be useful for identifying the molecular profile of patients with good or bad prognostic, as well as for understanding the disease.
- In marketing for market segmentation by identifying subgroups of customers with similar profiles and who might be receptive to a particular form of advertising.
- In City-planning for identifying groups of houses according to their type, value and location.
Key features of this book
Although there are several good books on unsupervised machine learning/clustering and related topics, we felt that many of them are either too high-level, theoretical or too advanced. Our goal was to write a practical guide to cluster analysis, elegant visualization and interpretation.
The main parts of the book include:
- distance measures,
- partitioning clustering,
- hierarchical clustering,
- cluster validation methods, as well as,
- advanced clustering methods such as fuzzy clustering, density-based clustering and model-based clustering.
The book presents the basic principles of these tasks and provide many examples in R. This book offers solid guidance in data mining for students and researchers.
Key features:
- Covers clustering algorithm and implementation
- Key mathematical concepts are presented
- Short, self-contained chapters with practical examples. This means that, you don’t need to read the different chapters in sequence.
How this book is organized?
This book contains 5 parts. Part I (Chapter 1 - 3) provides a quick introduction to R (chapter 1) and presents required R packages and data format (Chapter 2) for clustering analysis and visualization.
The classification of objects, into clusters, requires some methods for measuring the distance or the (dis)similarity between the objects. Chapter 3 covers the common distance measures used for assessing similarity between observations.
Part II starts with partitioning clustering methods, which include:
- K-means clustering (Chapter 4),
- K-Medoids or PAM (partitioning around medoids) algorithm (Chapter 5) and
- CLARA algorithms (Chapter 6).
Partitioning clustering approaches subdivide the data sets into a set of k groups, where k is the number of groups pre-specified by the analyst.

In Part III, we consider agglomerative hierarchical clustering method, which is an alternative approach to partitionning clustering for identifying groups in a data set. It does not require to pre-specify the number of clusters to be generated. The result of hierarchical clustering is a tree-based representation of the objects, which is also known as dendrogram (see the figure below).
In this part, we describe how to compute, visualize, interpret and compare dendrograms:
- Agglomerative clustering (Chapter 7)
- Algorithm and steps
- Verify the cluster tree
- Cut the dendrogram into different groups
- Compare dendrograms (Chapter 8)
- Visual comparison of two dendrograms
- Correlation matrix between a list of dendrograms
- Visualize dendrograms (Chapter 9)
- Case of small data sets
- Case of dendrogram with large data sets: zoom, sub-tree, PDF
- Customize dendrograms using dendextend
- Heatmap: static and interactive (Chapter 10)
- R base heat maps
- Pretty heat maps
- Interactive heat maps
- Complex heatmap
- Real application: gene expression data
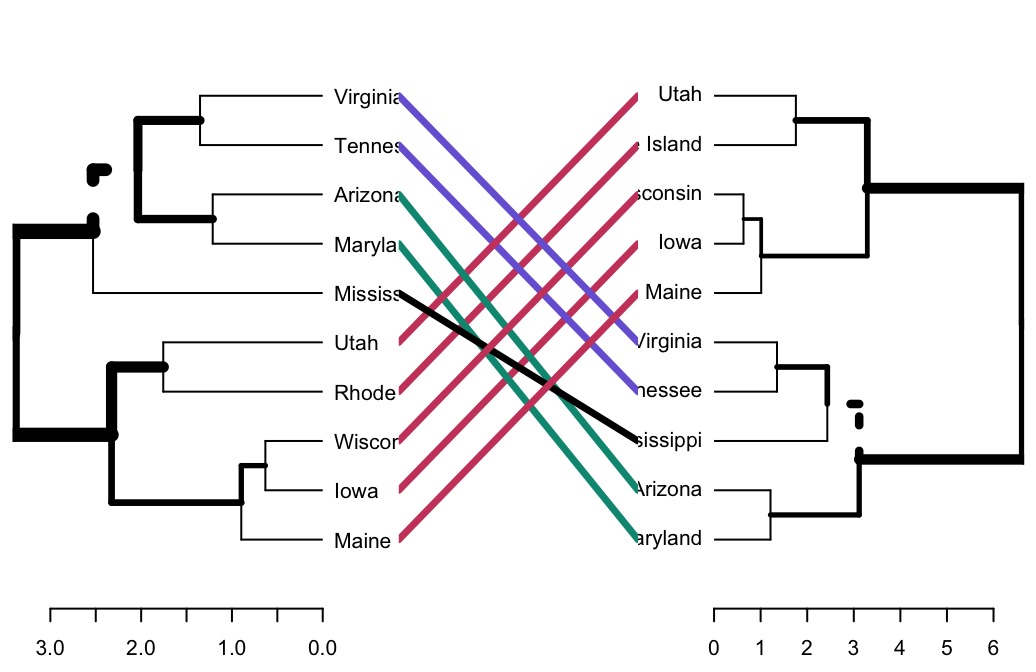
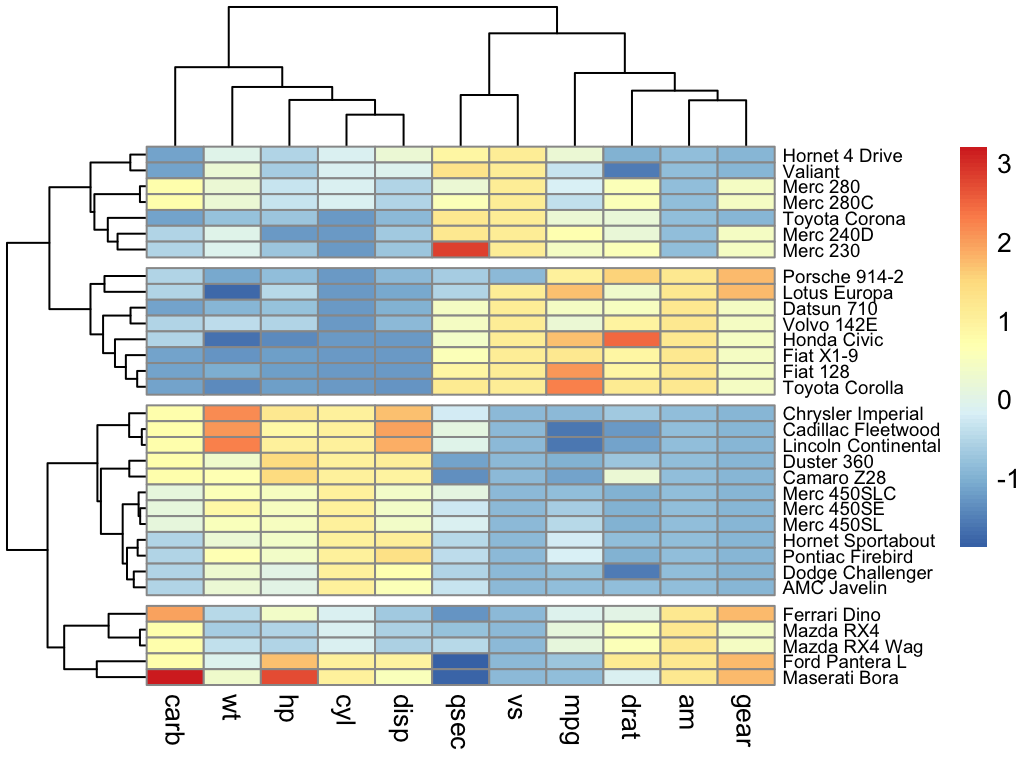
In this section, you will learn how to generate and interpret the following plots.
- Standard dendrogram with filled rectangle around clusters:

- Compare two dendrograms:
- Heatmap:
Part IV describes clustering validation and evaluation strategies, which consists of measuring the goodness of clustering results. Before applying any clustering algorithm to a data set, the first thing to do is to assess the clustering tendency. That is, whether applying clustering is suitable for the data. If yes, then how many clusters are there. Next, you can perform hierarchical clustering or partitioning clustering (with a pre-specified number of clusters). Finally, you can use a number of measures, described in this chapter, to evaluate the goodness of the clustering results.
The different chapters included in part IV are organized as follow:
- Assessing clustering tendency (Chapter 11)
- Determining the optimal number of clusters (Chapter 12)
- Cluster validation statistics (Chapter 13)
- Choosing the best clustering algorithms (Chapter 14)
- Computing p-value for hierarchical clustering (Chapter 15)
In this section, you’ll learn how to create and interpret the plots hereafter.
- Visual assessment of clustering tendency (left panel): Clustering tendency is detected in a visual form by counting the number of square shaped dark blocks along the diagonal in the image.
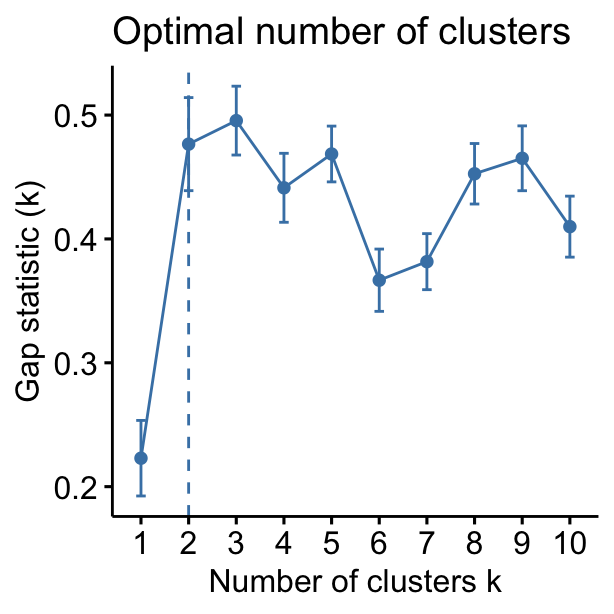
- Determine the optimal number of clusters (right panel) in a data set using the gap statistics.
## Clustering k = 1,2,..., K.max (= 10): .. done
## Bootstrapping, b = 1,2,..., B (= 100)  [one "." per sample]:
## .................................................. 50
## .................................................. 100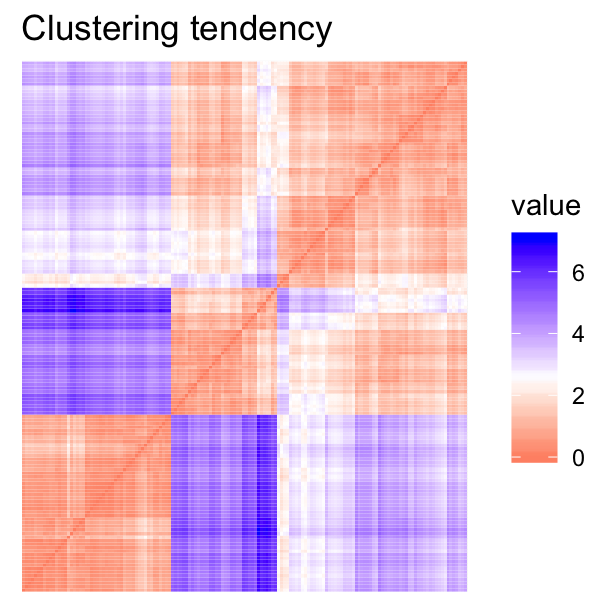
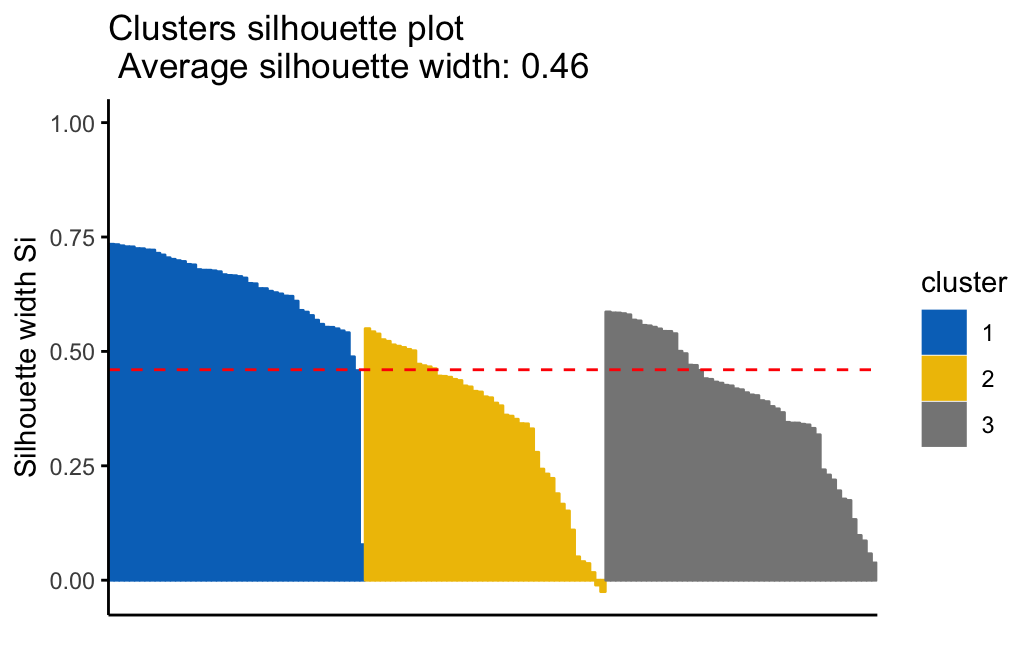
- Cluster validation using the silhouette coefficient (Si): A value of Si close to 1 indicates that the object is well clustered. A value of Si close to -1 indicates that the object is poorly clustered. The figure below shows the silhouette plot of a k-means clustering.
Part V presents advanced clustering methods, including:
- Hierarchical k-means clustering (Chapter 16)
- Fuzzy clustering (Chapter 17)
- Model-based clustering (Chapter 18)
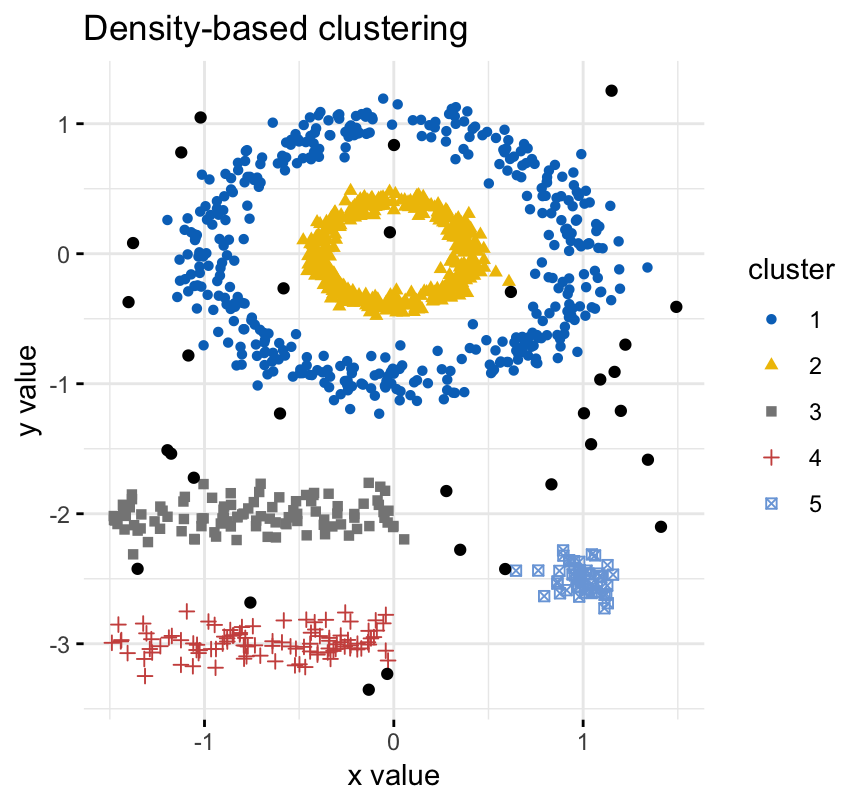
- DBSCAN: Density-Based Clustering (Chapter 19)
The hierarchical k-means clustering is an hybrid approach for improving k-means results.
In Fuzzy clustering, items can be a member of more than one cluster. Each item has a set of membership coefficients corresponding to the degree of being in a given cluster.
In model-based clustering, the data are viewed as coming from a distribution that is mixture of two ore more clusters. It finds best fit of models to data and estimates the number of clusters.
The density-based clustering (DBSCAN is a partitioning method that has been introduced in Ester et al. (1996). It can find out clusters of different shapes and sizes from data containing noise and outliers.
Version:
 English
39 avis pour Practical Guide to Cluster Analysis in R
Il n’y a pas encore d’avis.