Introduction
This content offers a comprehensive guide on working with figures in Quarto documents, including:
- Basic figure inclusion and customization of size using width and height attributes.
- Enhancing figures with links, titles, alignments, alt text, and lightbox features for larger view.
- Cross-referencing figures within the text for cohesive documentation.
- Organizing figures in groups, panels, or multiple rows/columns for structured presentation.
- Adjusting caption locations and creating complex layouts for detailed visual arrangements.
- Managing figures generated by executable code blocks with specific chunk options for ID, caption, alignment, and size.
- Employing the
layoutattribute for both static and computational figures to achieve desired visual layouts. - Utilizing block layout techniques to structure content effectively in multi-column formats.
Each section provides syntax examples and practical tips for effective figure management in documentation, making it an essential resource for enhancing visual elements in your content.
Figure Basics
Include a figure:
Figure Sizing
Specify width and height attributes to change the figure size, for example:
# Use convention measurements
{width=300}
# Or use percentage
{width=80%}
# Or use inches
{width=4in}The height will be calculated automatically if you only specify width.
Linked Figures
[](https://en.wikipedia.org/wiki/Elephant)Figure Title, Alignment and Alt Text
{fig-align="left" fig-alt="A drawing of an elephant." width=20%}Lightbox Figures
Allows users to click on a figure to view larger version.
Include the lightbox class in the figure’s attributes:
{.lightbox}Output:
Cross References
Cross-referencing can be done for both static markdown and computational figures.
Markdown Figures
- Add
fig-prefix to figure IDs for cross-referencing. - Reference figures using
@prefix:
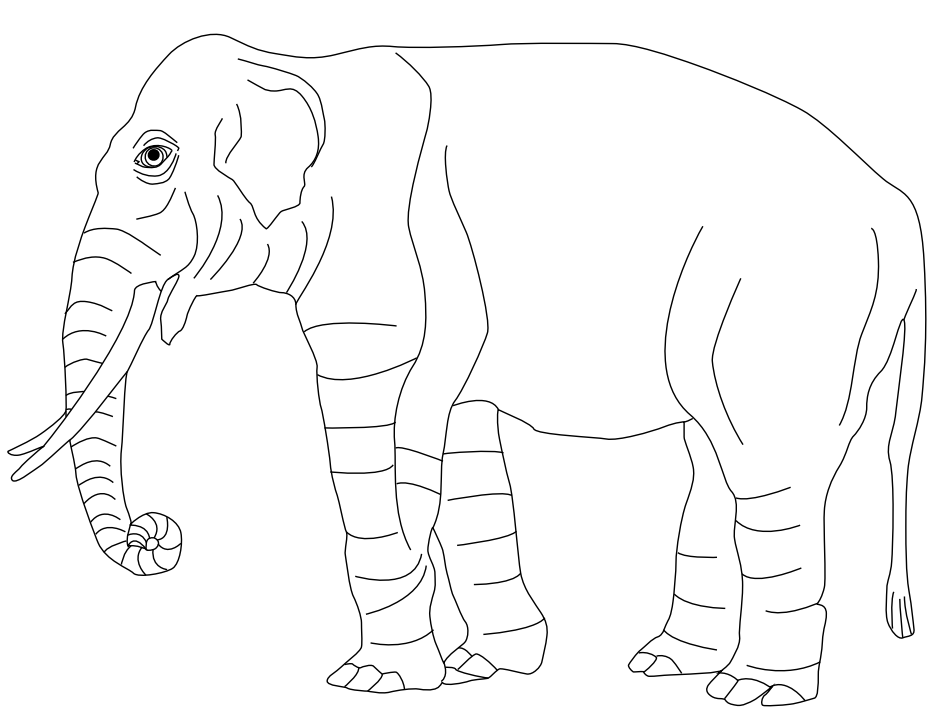
{#fig-elephant}
See @fig-elephant.Output:
See Figure 1.
Figures from Code
Include a fig- prefix in the label for referencing:
For a demonstration of a line plot, see @fig-line-plot.

```{python}
#| label: fig-line-plot
#| fig-cap: "A line plot "

import matplotlib.pyplot as plt
plt.plot([1,23,2,4])
plt.show()
```
Div Syntax
To cross-reference a figure using div syntax, the image is followed by the caption inside the div:
For figures, wrap the image and caption in a
fig-prefixed div:::: {#fig-elephant}  An Elephant :::Reference figures from executable code by enclosing the code in a similar div:
::: {#fig-line-plot}

```{python}
import matplotlib.pyplot as plt
plt.plot([1,23,2,4])
plt.show()
```

A line plot
:::
Refer to figures with @fig-. To reference also the code, use code chunk options instead of div syntax: see Cross-References for Executable Code Blocks
Subfigures
Multiple Columns
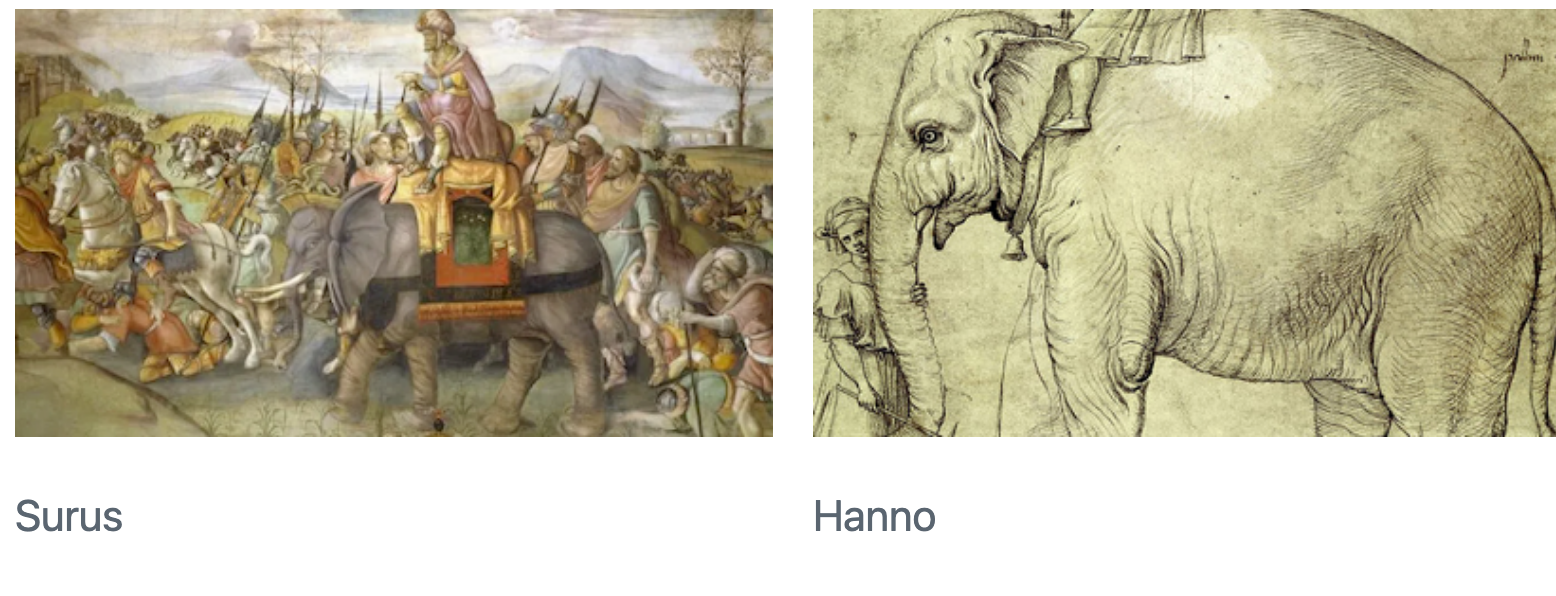
You can group related figures in a div with a main caption. Use layout-ncol=2 for side-by-side images, ensuring proper spacing:
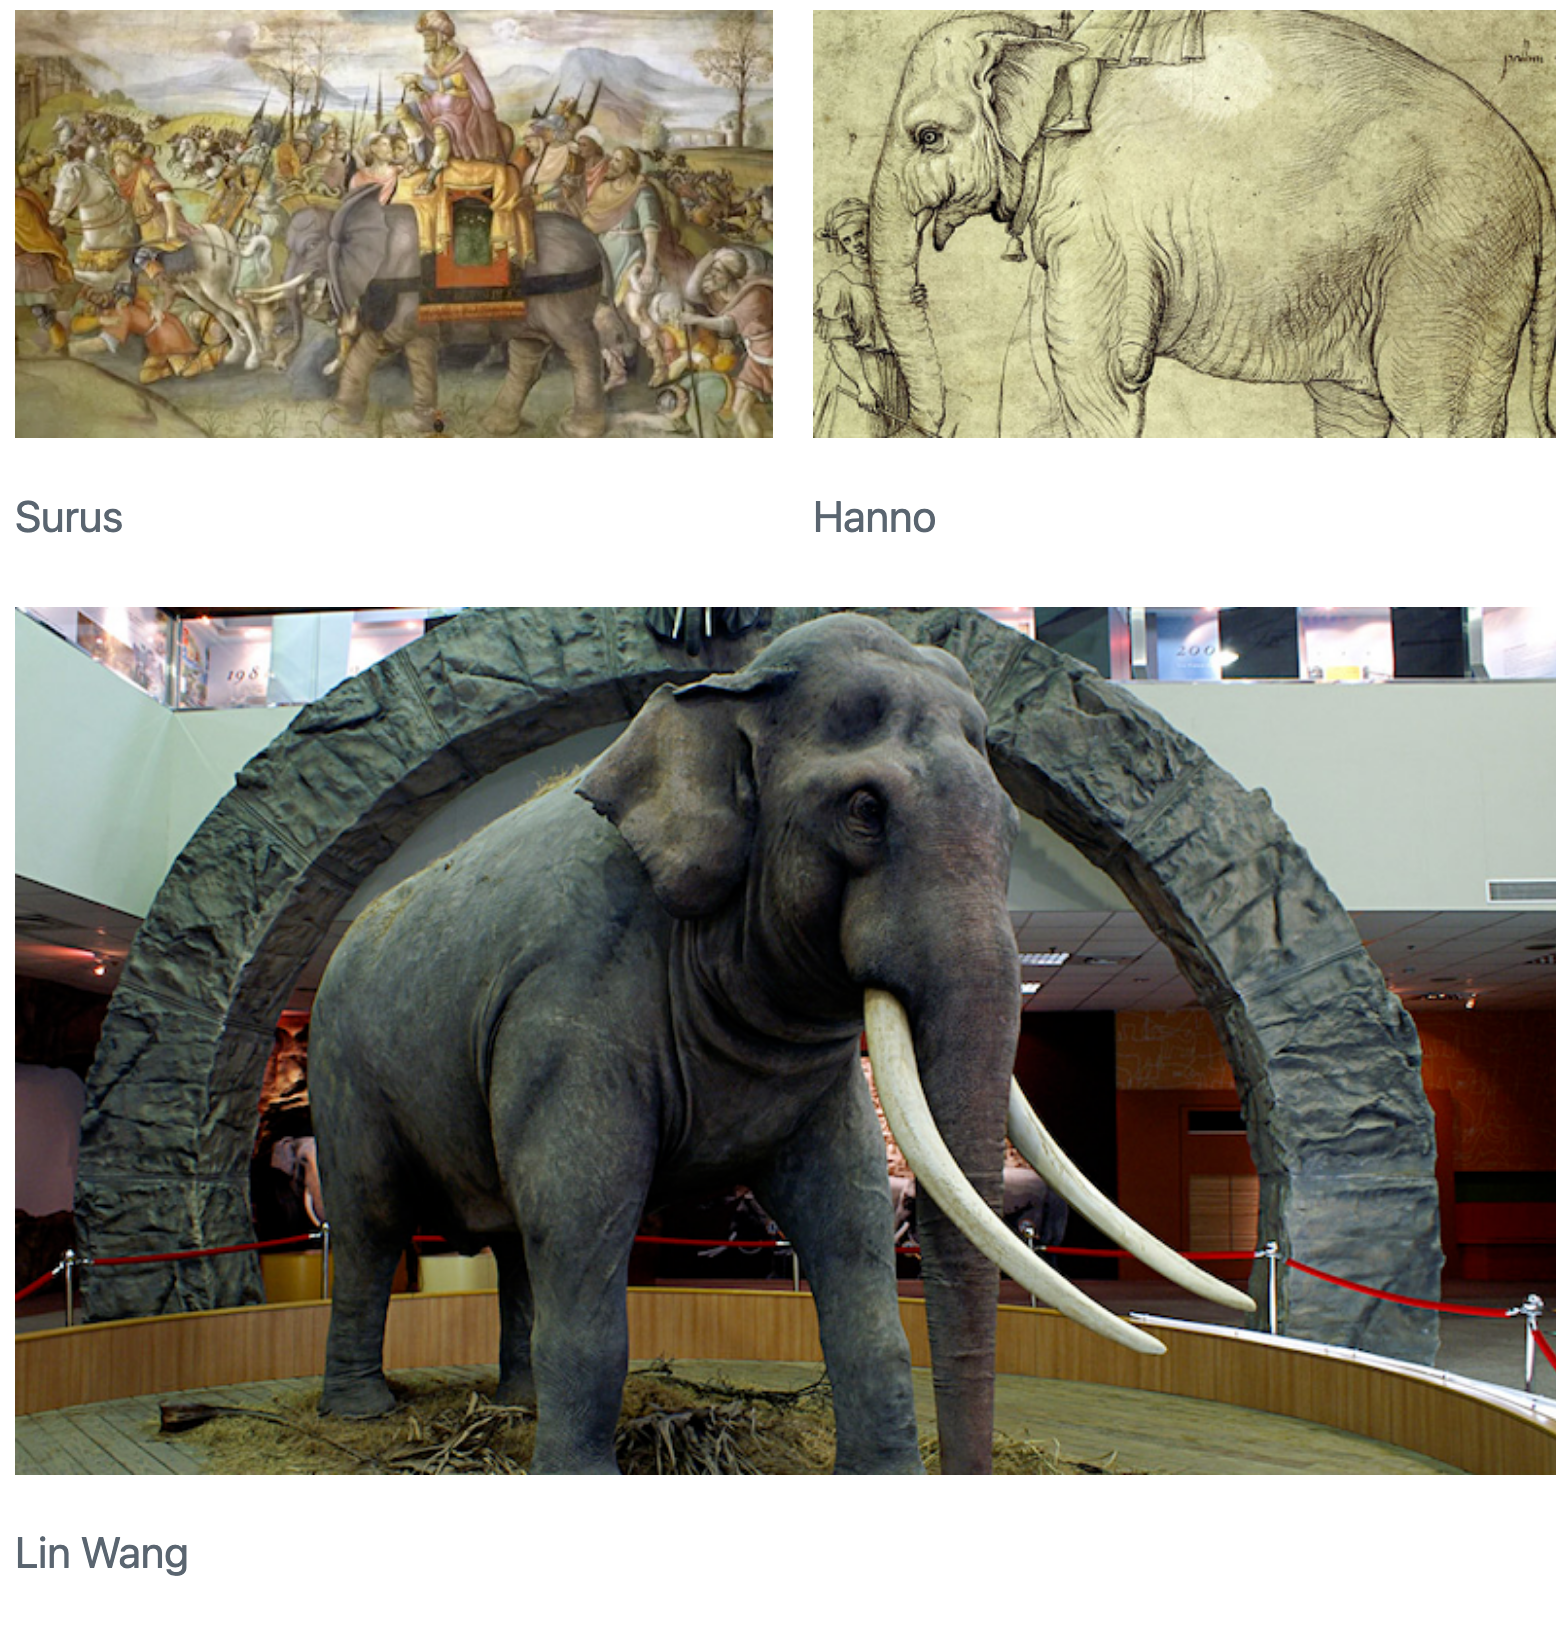
::: {#fig-elephants layout-ncol=2}
{#fig-surus}
{#fig-hanno}
Famous Elephants
:::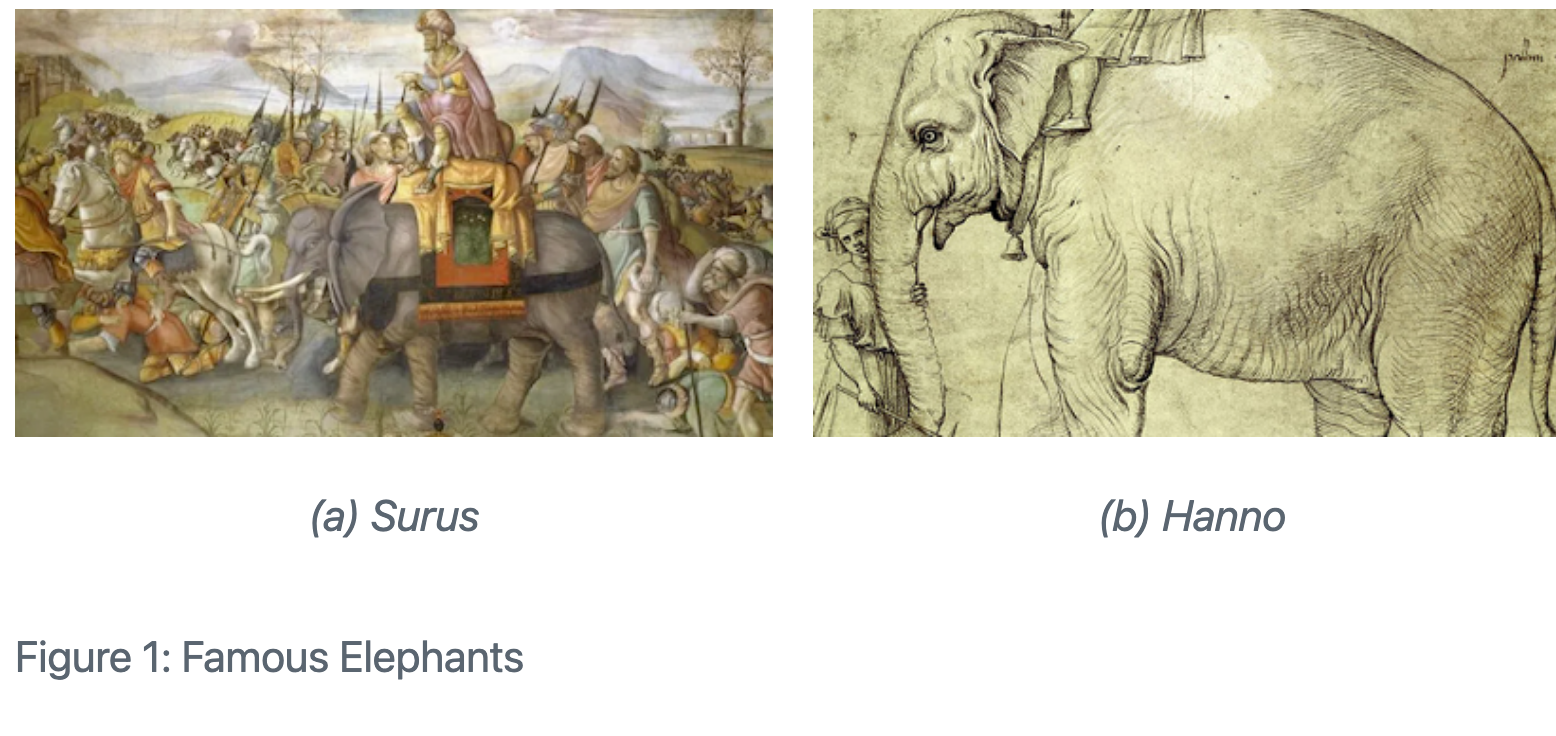
Figure Panels
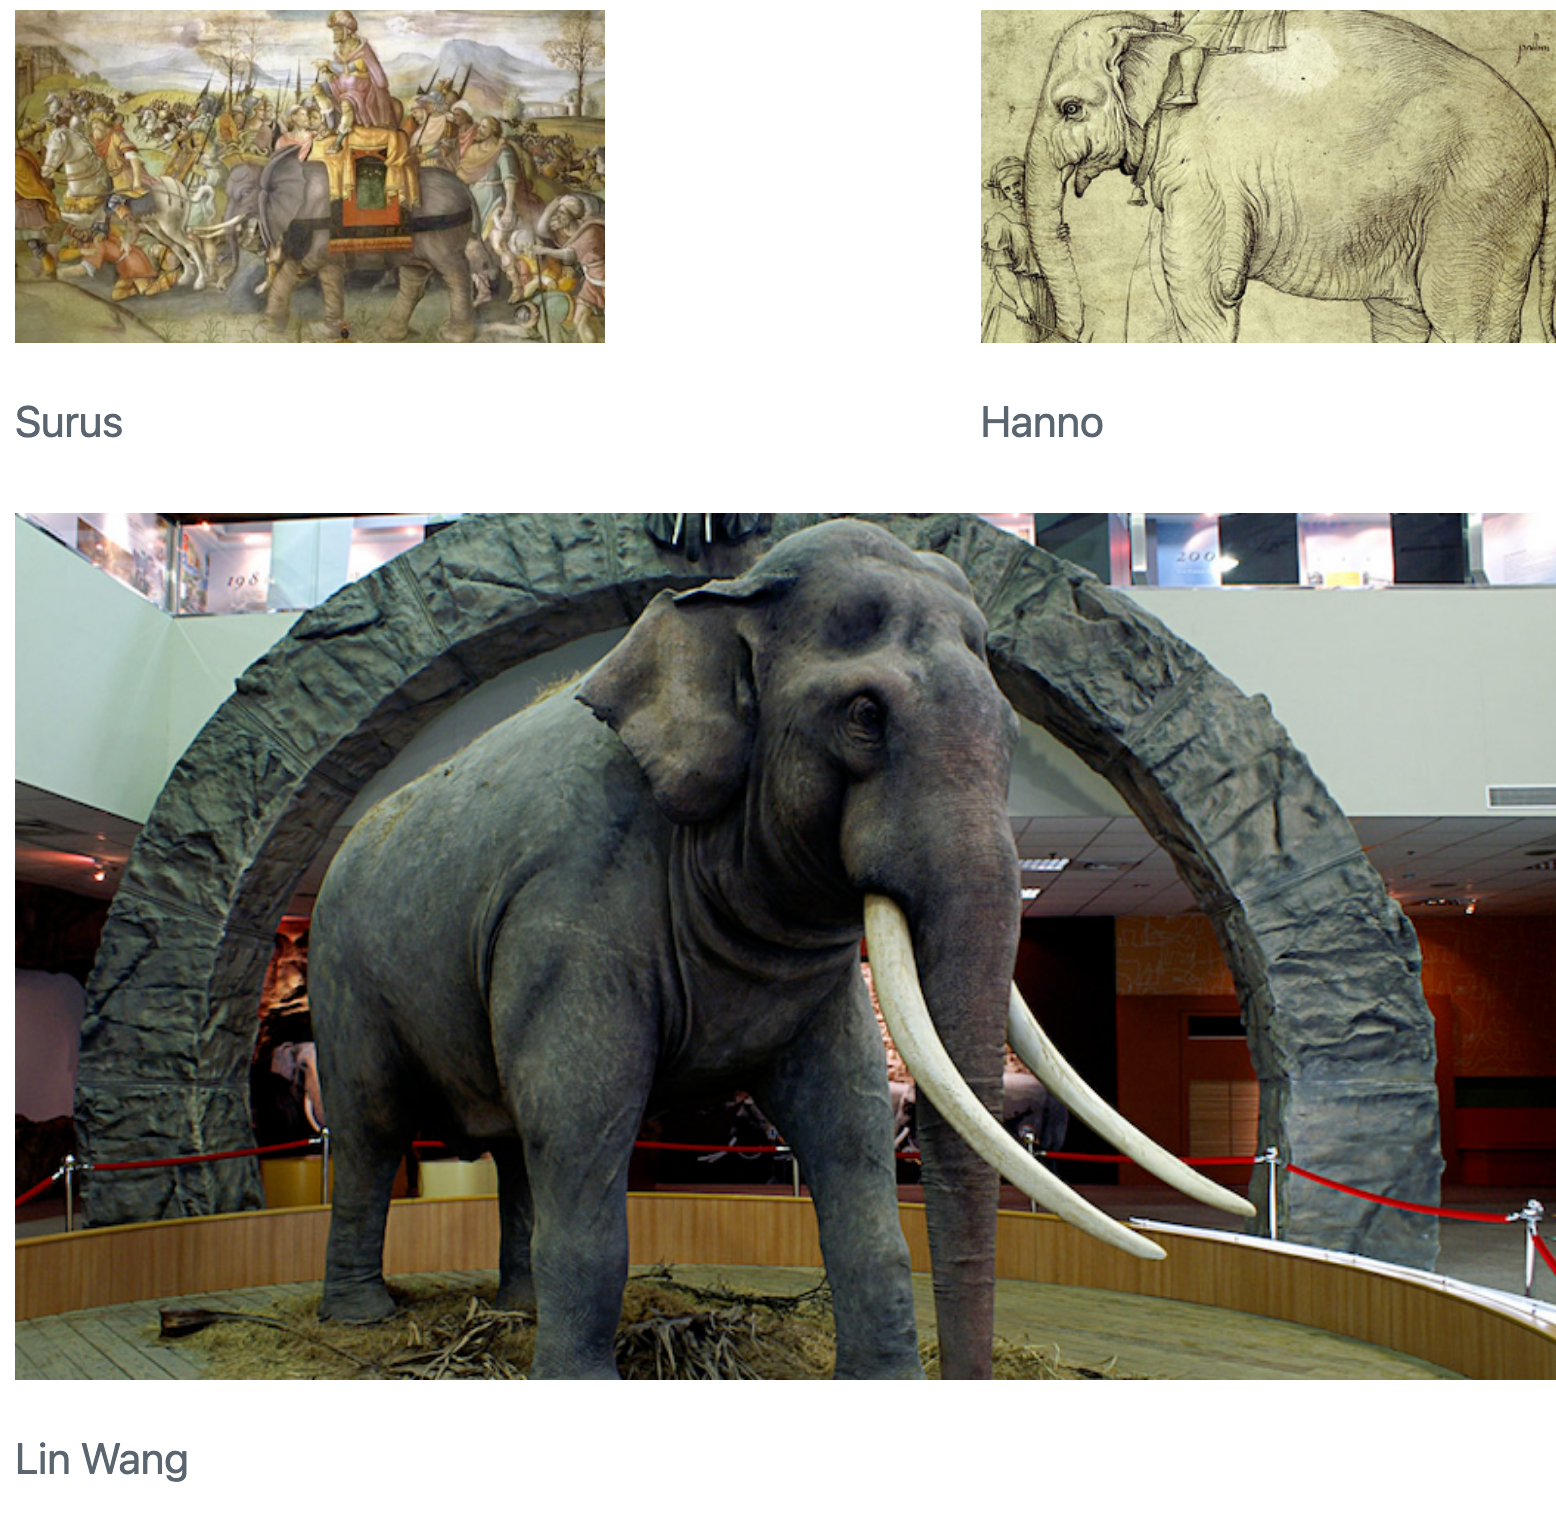
Omit #fig identifiers for figures without a main caption:
::: {layout-ncol=2}


:::
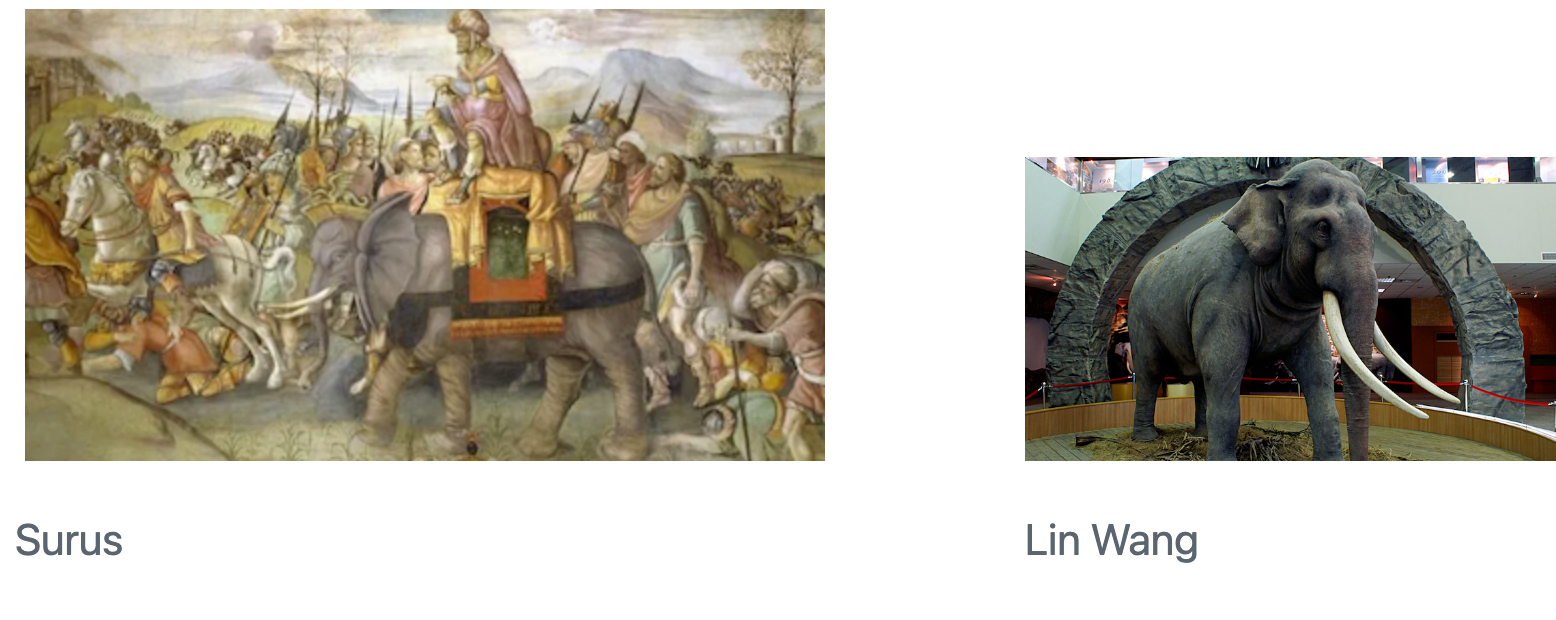
Exclude captions entirely by only including images:
::: {layout-ncol=2}


:::Multiple Rows
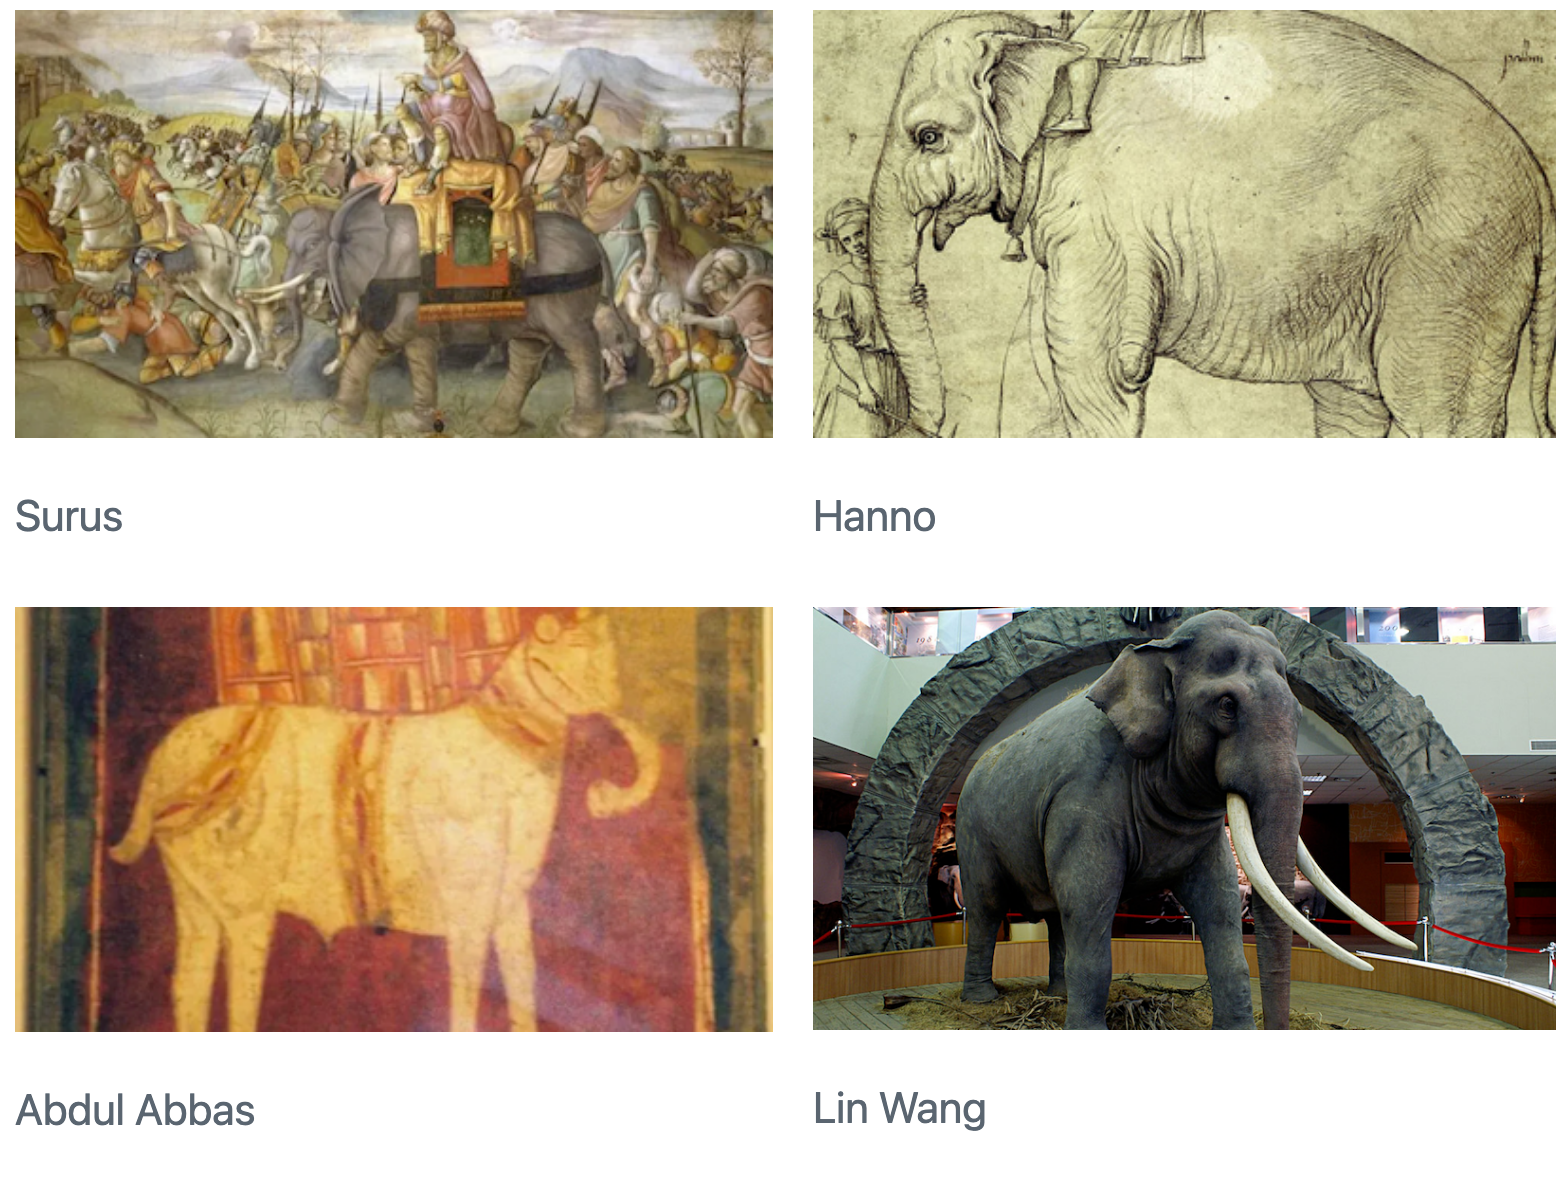
Use layout-nrow for specifying the number of rows:
::: {layout-nrow=2}


:::
Caption Locations
- Default location is below the figure.
- Use
fig-cap-locationin the document header (yamlsection) to change the location totop,bottom, ormargin:
---
fig-cap-location: top
---
Custom Layouts
Use the layout attribute for complex layouts, such as two equal-sized figures in the first row and a single image spanning the second row.
::: {layout="[[1,1], [1]]"}


:::- The
layoutattribute uses a 2D array to define rows and columns. "layout="[[1,1], [1]]"means two rows: the first with two equal columns and the second with one column.
Define columns that occupy varying percentage widths of the row:
::: {layout="[[70,30], [100]]"}


:::Use negative values to create space between elements:
::: {layout="[[40,-20,40], [100]]"}


:::
Vertical Alignment
Control vertical alignment using the layout-valign attribute:
::: {layout="[15,-2,10]" layout-valign="bottom"}


:::
Note that vertical alignment isn’t limited to images, you can also vertically align any other elements that are included in a panel.
Computations
- Use chunk options
label,fig-cap, andfig-linkfor ID, caption, and link respectively. - Use chunk options
fig-alignandfig-altfor alignment and alt text respectively. - Adjust default figure size with
fig-widthandfig-heightin the document header. - Read more at Execution Options: Figure Options section.
Layout
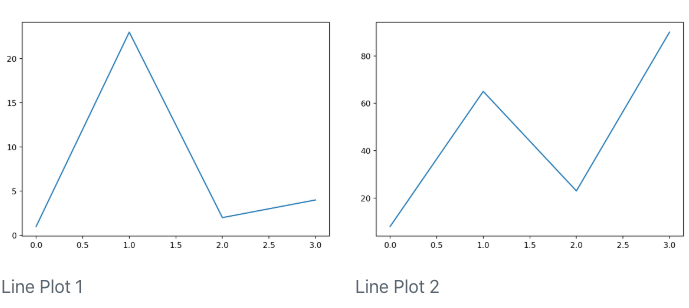
The layout attributes also work for figures produced by executable code blocks. Here are examples for both Jupyter and Knitr:
```{python}
#| layout-ncol: 2
#| fig-cap:
#|   - "Line Plot 1"
#|   - "Line Plot 2"

import matplotlib.pyplot as plt
plt.plot([1,23,2,4])
plt.show()

plt.plot([8,65,23,90])
plt.show()
```
```{r}
#| layout-ncol: 2
#| fig-cap:
#|   - "Speed and Stopping Distances of Cars"
#|   - "Vapor Pressure of Mercury as a Function of Temperature"

plot(cars)
plot(pressure)
```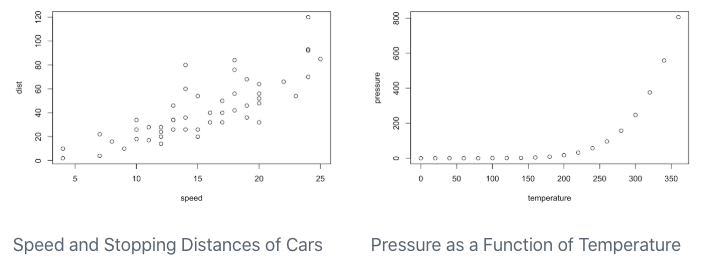
Note that in these examples we also use the fig-cap option to apply a caption to each of the generated figures.
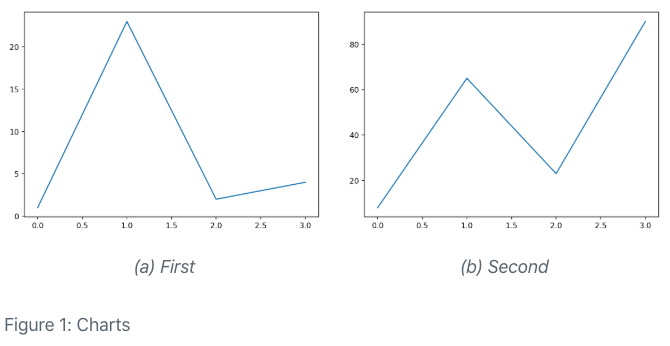
Subcaptions
- Create subcaptions for computational output by combining the
fig-capandfig-subcapoptions. - Optionally include a
labelwith afig-prefix. In this case, the figure will be numbered and cross-referenceable.
```{python}
#| label: fig-charts
#| fig-cap: "Charts"
#| fig-subcap:
#|   - "First"
#|   - "Second"
#| layout-ncol: 2

import matplotlib.pyplot as plt
plt.plot([1,23,2,4])
plt.show()

plt.plot([8,65,23,90])
plt.show()
```
```{r}
#| label: fig-charts
#| fig-cap: "Charts"
#| fig-subcap:
#|   - "Cars"
#|   - "Pressure"
#| layout-ncol: 2

plot(cars)
plot(pressure)
```
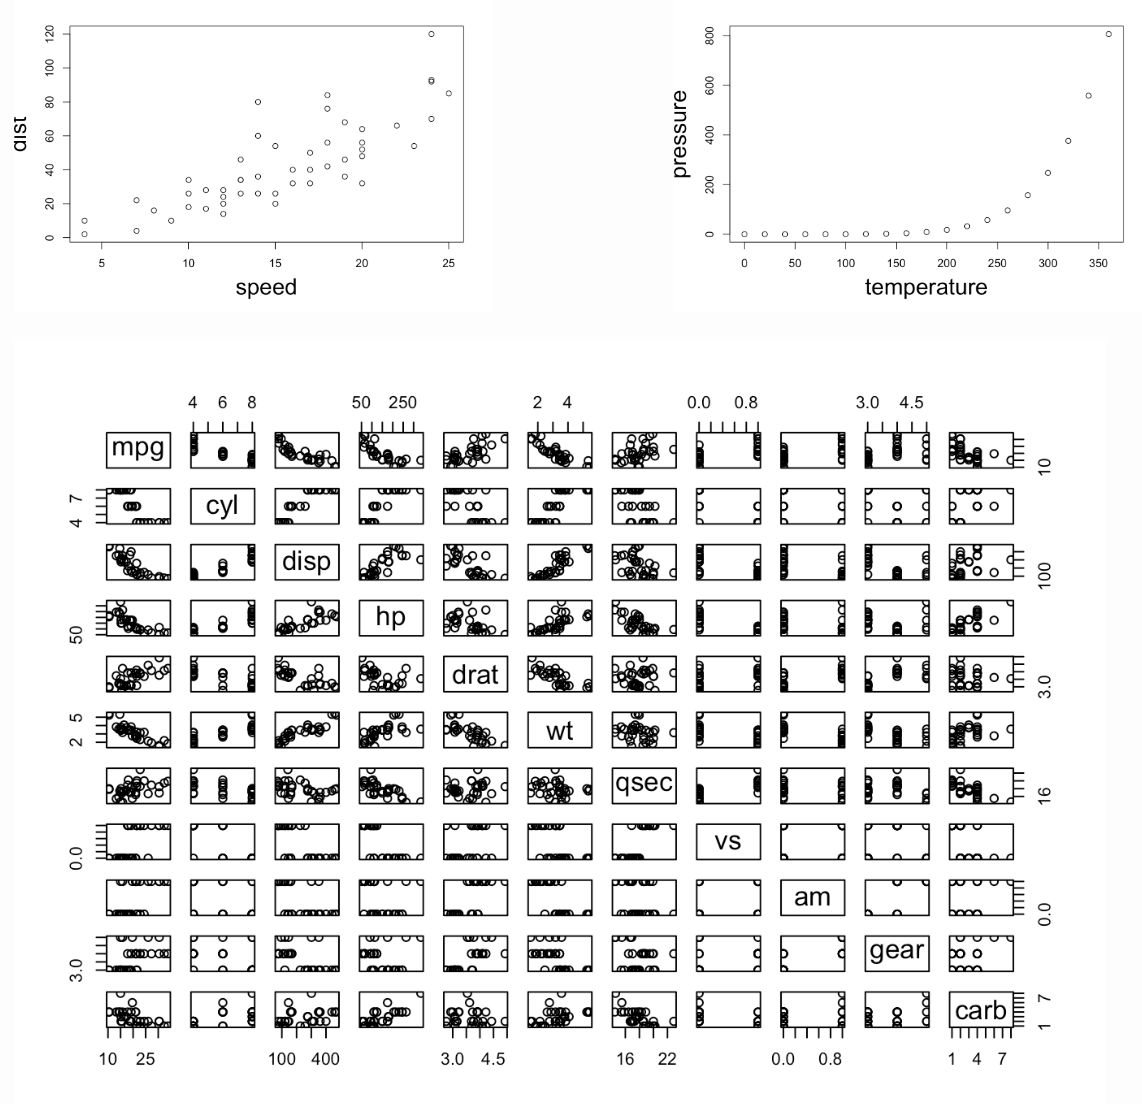
Custom Layout
The layout works the same way for figures produced by Knitr or Jupyter. For example, here’s an Rmd code chunk that produces 3 plots and defines a custom layout for them:
```{r}
#| layout: [[45,-10, 45], [100]]

plot(cars)
plot(pressure)
plot(mtcars)
```
Block Layout
Block contents with headings:
::: {layout-ncol=2}
### List One

- Item A
- Item B
- Item C

### List Two

- Item X
- Item Y
- Item Z
:::
List One
- Item A
- Item B
- Item C
List Two
- Item X
- Item Y
- Item Z
Block contents without headings:
::: {layout-ncol=2}
- Item X
- Item Y
- Item Z

This is a paragraph displayed on the right side (second column).
:::- Item X
- Item Y
- Item Z
This is a paragraph displayed on the right side (second column).
Use divs (:::) to divide complicated contents into blocks for the layout:
:::: {layout="[ 40, 60 ]"}
::: {#first-column}
```r
# Some code
print("Hello World")
```
Some text that should be displayed below the code.
:::
::: {#second-column}

:::
::::The id attributes (#first-column and #second-column) are optional, but aid readability.
# Some code
print("Hello World")Some text that should be displayed below the code.