Interactive Charts in R: Choosing the Right Package (ggiraph, echarts4r, plotly & more)
An honest chooser — match the package to what you already use, the interaction you need, and where you’ll publish
Data Visualization
An honest, practical guide to interactive charts and plots in R: when to reach for ggiraph, echarts4r, plotly, or highcharter, plus leaflet for maps and DT/reactable/gt for tables. Includes a side-by-side comparison of interactions, weight, and licensing — and the commercial-licence caveat you must know before shipping Highcharts.
TipWhat you’ll find here
- A one-line answer to “which R package for interactive charts?” — it depends on what you already use, the interaction you need, and where you’ll publish.
- A side-by-side comparison table — interactions, weight/performance, and licensing.
- When to reach for each:
ggiraph,echarts4r,plotly,highcharter, plusleaflet(maps) andDT/reactable/gt(tables). - The commercial-licence caveat you must know before shipping Highcharts.
- A short decision guide to pick in ten seconds.
You have a chart in R and you want it to be interactive — hover for a tooltip, zoom into a region, click to filter. The good news: R has excellent options. The catch: the “best” one depends less on the charts and more on your situation. Are you already deep in ggplot2? Do you need a fancy control ggplot2 can’t draw (animated transitions, a zoom slider, a sankey)? And where does the chart land — a report, a Shiny app, a public commercial site? This guide answers those questions honestly, without pretending one package wins every time.
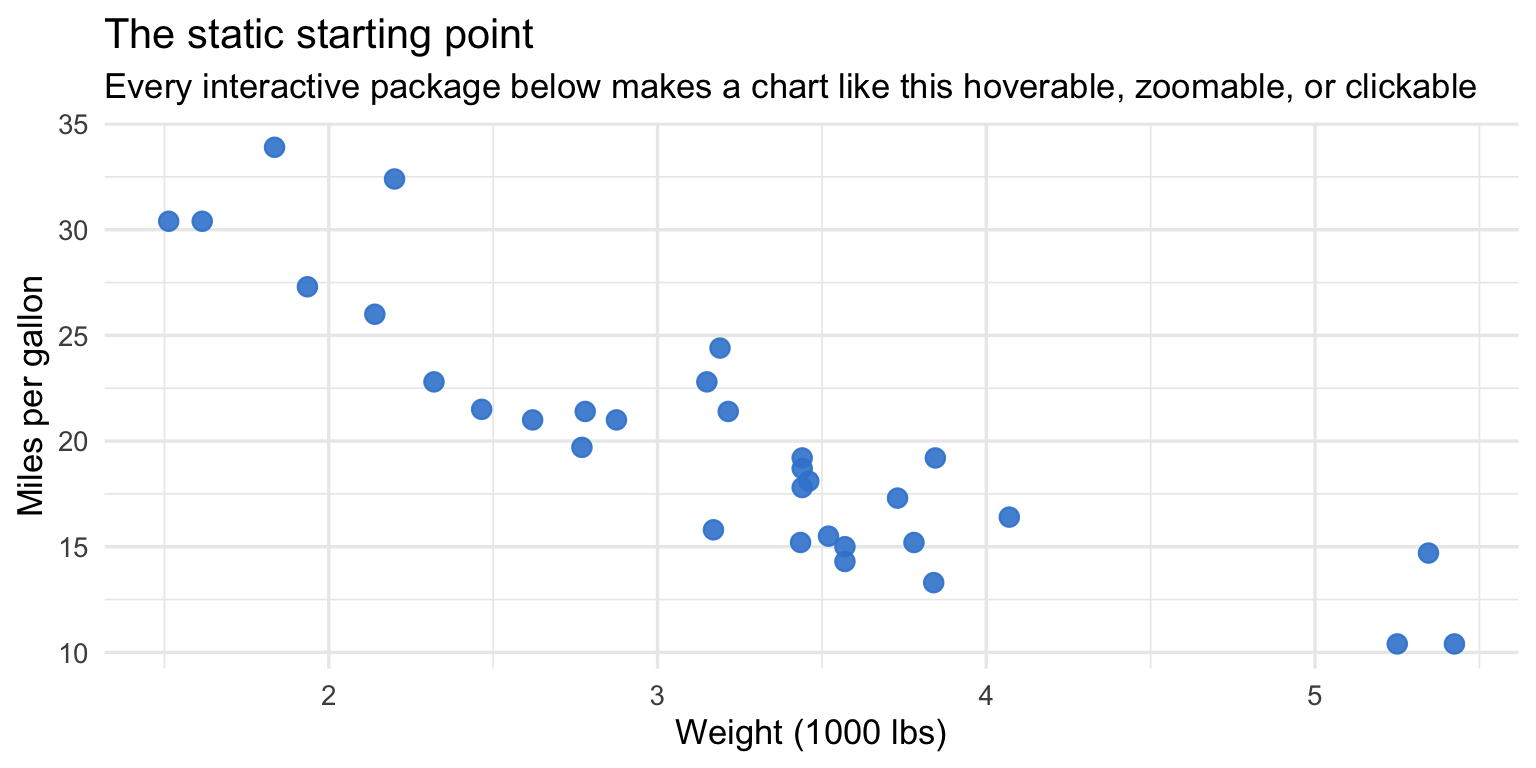
Everything below starts from the same place: an ordinary static ggplot2 chart. That is the “before” — interactive packages are what turn it into something you can hover, zoom, and click.
The quick answer
- Already on ggplot2 and you want light interactivity (tooltips, hover, click) → ggiraph.
- Need rich built-in controls ggplot2 can’t draw — zoom sliders, animated transitions, treemaps, sunbursts, sankey, gauges, calendar heatmaps → echarts4r.
- Want the broadest chart coverage and a one-call ggplot2 conversion → plotly.
- Interactive maps → leaflet. Interactive tables → DT / reactable / gt.
- Considering highcharter? It’s polished, but check the Highcharts licence first — it’s free for personal/non-commercial use and paid for commercial use.
Comparison at a glance
Each of these renders an htmlwidget (an interactive HTML/JavaScript object that works in a Quarto/R Markdown report or a Shiny app). They differ in the interactions they offer, the size of the JavaScript they ship (which affects page load), and — importantly — their licence.
| Package | Best for | Interactions | Weight / perf | Licensing | Our guide |
|---|---|---|---|---|---|
| ggiraph | Making your existing ggplot2 charts interactive | Tooltip, hover, click, selection | Light — renders SVG, keeps the ggplot2 look | GPL-3 (free, open-source) | ggiraph series |
| echarts4r | Rich built-in controls ggplot2 can’t draw | Zoom/data-zoom slider, animated transitions, brush, click | Heavier JS payload | Apache-2.0 (free, open-source) | echarts4r series |
| plotly | Broad chart coverage + one-call ggplotly() |
Hover, zoom, pan, box/lasso select | Heavier JS bundle | MIT (free, open-source) | Convert with ggplotly() |
| highcharter | Polished, well-styled charts | Hover, zoom, drilldown | Medium JS | Highcharts: free non-commercial, paid for commercial use | Check the licence first |
| leaflet | Interactive maps | Pan, zoom, markers, popups | Medium | Free, open-source | Future series |
| DT / reactable / gt | Interactive tables | Sort, filter, paginate, search | Light–medium | Free, open-source | Future series |
The rows below explain the trade-offs behind that table.
ggiraph — interactive ggplot2, kept lightweight
ggiraph makes your existing ggplot2 charts interactive without leaving the grammar of graphics. You swap a geom for its interactive twin (geom_point_interactive(), geom_col_interactive(), …) and add tooltip, data_id (for hover/selection), or onclick aesthetics. It renders the chart as SVG (a lightweight, crisp vector format), so the output stays close to the publication-quality look ggplot2 already gives you, and the payload is small. This is the right first choice when you’re already invested in ggplot2 and want tooltips or click-to-select without rebuilding the chart in a new library.
library(ggplot2)
library(ggiraph)

gg <- ggplot(mtcars, aes(wt, mpg, tooltip = rownames(mtcars), data_id = rownames(mtcars))) +
  geom_point_interactive(color = "#3a86d4", size = 3) +
  theme_minimal()

girafe(ggobj = gg)   # renders the interactive SVG
Start here: the ggiraph series — tooltips, hover/click, interactive geoms, theming, and even making ggpubr/factoextra figures interactive.
echarts4r — rich interactions ggplot2 can’t draw
echarts4r is a tidy, pipe-friendly wrapper over Apache ECharts, a mature JavaScript charting library. Reach for it when you need interactions that live beyond the static grammar: a zoom (data-zoom) slider, animated transitions, treemaps, sunbursts, sankey diagrams, gauges, or calendar heatmaps. The trade-off is a heavier JavaScript payload than ggiraph’s SVG — worth it when those richer controls are the point, less so for a simple hover tooltip.
library(echarts4r)

mtcars |>
  e_charts(wt) |>
  e_scatter(mpg, symbol_size = 12) |>
  e_color("#3a86d4") |>
  e_tooltip() |>
  e_datazoom()          # a draggable zoom slider — pure echarts4r
echarts4r is Apache-2.0 licensed — free and open-source, so there’s no licensing snag for commercial use. Start here: the echarts4r series — bar, line, scatter, distribution, time series, treemap/sunburst, sankey/network, pie/donut/gauge, calendar heatmaps, and theming.
plotly — broad coverage and one-call conversion
plotly is one of the most widely used interactive libraries, and its headline convenience is ggplotly(): pass it an existing ggplot2 object and it returns an interactive version in a single call. It also covers a very broad range of chart types natively and gives you hover, zoom, pan, and box/lasso selection out of the box. The trade-off is a heavier JavaScript bundle than ggiraph — something to weigh on a performance-sensitive, mobile-first page. (On development pace: plotly is less actively developed than some of the newer alternatives, but it remains stable, popular, and well-documented.)
library(ggplot2)
library(plotly)

gg <- ggplot(mtcars, aes(wt, mpg)) +
  geom_point(color = "#3a86d4", size = 3) +
  theme_minimal()

ggplotly(gg)          # one call → an interactive version
plotly is MIT licensed — free and open-source for commercial use.
highcharter — polished, but mind the licence
highcharter wraps Highcharts, a JavaScript library known for beautiful, well-styled charts, and the R API is pleasant to use. The important, load-bearing caveat is about the licence of the underlying Highcharts library (not the R wrapper): Highcharts is free for personal and non-commercial use, but requires a paid commercial licence for any commercial or for-profit context — not only a public product or site, but also internal business use (prototypes, R&D, internal dashboards at a for-profit company). Highcharts’ own terms make this explicit — the Standard License Agreement governs commercial use (with non-commercial usage under “separate terms”), and the product page states that “when you are ready to use the software for commercial projects, the appropriate license must be in place.” So highcharter is great for learning and non-commercial work, but check the Highcharts licence before using it in any for-profit setting.
If you need a free-to-deploy interactive package for commercial work, prefer ggiraph (GPL-3) or echarts4r (Apache-2.0) — both are fully open-source with no commercial-use fee.
leaflet — the go-to for interactive maps
When the chart is a map, R users reach for leaflet (a wrapper over the Leaflet.js mapping library). It gives you pan/zoom tiles, markers, popups, and choropleth layers — the natural home for spatial data, which the general-purpose charting packages above don’t specialise in. A dedicated Datanovia series is planned; for now, know that “interactive map in R” almost always means leaflet.
DT, reactable & gt — for interactive tables
An interactive table is a different need from an interactive chart, and R has three strong options: DT (a wrapper over the DataTables library — sort/filter/paginate/search), reactable (modern, highly customisable interactive tables), and gt (publication-grade tables, with growing interactivity). If your goal is a searchable, sortable data grid rather than a plot, reach for one of these instead of a charting package. Dedicated coverage is planned.
Our recommendation — decide in ten seconds
- Already using ggplot2 + you want light interactivity (tooltips, hover, click)? → ggiraph. You keep your charts and the publication look, and the SVG output stays light.
- Need a rich built-in interaction — zoom slider, animated transition, treemap, sunburst, sankey, gauge, calendar heatmap? → echarts4r. It draws things ggplot2 simply can’t.
- Want the broadest chart coverage or a one-call ggplot2 conversion? → plotly (
ggplotly()), accepting a heavier bundle. - Making a map? → leaflet. Making a table? → DT / reactable / gt.
- Considering highcharter for anything commercial? → confirm the Highcharts licence first, or switch to ggiraph/echarts4r to stay free-to-deploy.
For most R users the honest default is: ggiraph if you live in ggplot2, echarts4r when you need more than ggplot2 can express.
Frequently asked questions
NoteWhat is the best R package for interactive charts?
There is no single winner — it depends on your situation. If you already use ggplot2 and want tooltips, hover, or click, ggiraph keeps your charts and stays lightweight. If you need richer built-in controls (a zoom slider, animated transitions, treemaps, sankey, gauges), echarts4r does what ggplot2 can’t. For the broadest chart coverage plus a one-call ggplot2 conversion, plotly and its ggplotly() are convenient. Match the package to what you already use, the interaction you need, and where the chart will be published.
Noteggiraph vs plotly — which should I use?
Both make ggplot2 charts interactive, but they differ in weight and approach. ggiraph renders the chart as lightweight SVG and keeps you inside the ggplot2 grammar (swap in *_interactive() geoms and add tooltip /data_id aesthetics) — ideal when you want tooltips or selection without a heavy payload. plotly converts an existing ggplot2 object with a single ggplotly() call and offers very broad chart coverage, at the cost of a heavier JavaScript bundle. Choose ggiraph for a light, ggplot2-native result; choose plotly for one-call convenience and breadth.
NoteIs highcharter free to use?
The highcharter R package is free, but it wraps the Highcharts JavaScript library, which is free for personal and non-commercial use and requires a paid commercial licence for commercial or for-profit use (see the Highcharts product page and the Standard License Agreement). So it’s fine for learning and non-commercial projects, but confirm the licence before shipping it on a commercial site. For a free-to-deploy alternative, use ggiraph (GPL-3) or echarts4r (Apache-2.0).
NoteWhat’s the fastest / lightest interactive chart package in R?
For a small, fast payload, ggiraph is usually the lightest of the general charting options — it renders SVG rather than shipping a large JavaScript charting engine, so pages load quickly and the figures stay crisp. plotly and echarts4r bundle bigger JavaScript libraries (the price of their extra features), so on a performance- or mobile-sensitive page, prefer ggiraph unless you specifically need an interaction it can’t provide.
Conclusion
Don’t ask “which interactive charting package is best” in the abstract — ask what you already use and what interaction you actually need. If you live in ggplot2 and want light interactivity, ggiraph is the natural fit; when you need controls ggplot2 can’t draw, echarts4r is the honest upgrade; plotly buys breadth and a one-call conversion at the cost of weight; leaflet owns maps and DT/reactable/gt own tables. And before you reach for highcharter on anything commercial, check the Highcharts licence.
Citation
BibTeX citation:
@online{kassambara2026,
  author = {Kassambara, Alboukadel},
  title = {Interactive {Charts} in {R:} {Choosing} the {Right} {Package}
    (Ggiraph, Echarts4r, Plotly \& More)},
  date = {2026-07-09},
  url = {https://www.datanovia.com/blog/interactive-charts-in-r},
  langid = {en}
}
For attribution, please cite this work as:
Kassambara, Alboukadel. 2026. “Interactive Charts in R: Choosing
the Right Package (Ggiraph, Echarts4r, Plotly & More).” July
9. https://www.datanovia.com/blog/interactive-charts-in-r.