Prérequis
# Charger les packages R requis
library(tidyverse)
library(rstatix)
library(ggpubr)

# Préparer les données et inspecter un échantillon aléatoire des données
data("PlantGrowth")
set.seed(1234)
PlantGrowth %>% sample_n_by(group, size = 1)
## # A tibble: 3 x 2
## weight group
## <dbl> <fct>
## 1 5.58 ctrl
## 2 6.03 trt1
## 3 4.92 trt2Statistiques descriptives
PlantGrowth %>%
  group_by(group) %>%
  get_summary_stats(weight, type = "mean_sd")
## # A tibble: 3 x 5
## group variable n mean sd
## <fct> <chr> <dbl> <dbl> <dbl>
## 1 ctrl weight 10 5.03 0.583
## 2 trt1 weight 10 4.66 0.794
## 3 trt2 weight 10 5.53 0.443Comparer la moyenne de plusieurs groupes à l’aide du test ANOVA
res.aov <- PlantGrowth %>% anova_test(weight ~ group)
res.aov
## ANOVA Table (type II tests)
##
## Effect DFn DFd F p p<.05 ges
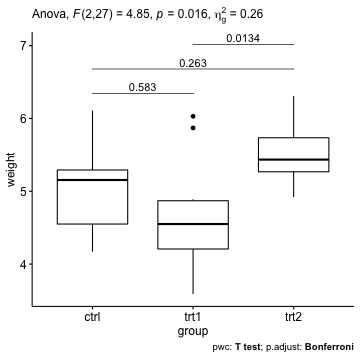
## 1 group 2 27 4.85 0.016 * 0.264Le tableau ANOVA ci-dessus montre qu’il existe des différences significatives entre les groupes (p = 0,016), qui sont mises en évidence par "*", F(2, 27) = 4,85, p = 0,016, eta2[g] = 0,26.
Tests par paires pour plusieurs groupes
# Comparaisons par paires
pwc <- PlantGrowth %>%
  pairwise_t_test(weight ~ group, p.adjust.method = "bonferroni")
pwc
## # A tibble: 3 x 9
## .y. group1 group2 n1 n2 p p.signif p.adj p.adj.signif
## * <chr> <chr> <chr> <int> <int> <dbl> <chr> <dbl> <chr>
## 1 weight ctrl trt1 10 10 0.194 ns 0.583 ns
## 2 weight ctrl trt2 10 10 0.0877 ns 0.263 ns
## 3 weight trt1 trt2 10 10 0.00446 ** 0.0134 *Visualisation : Boxplots avec p-values
# Afficher les p-values ajustées
pwc <- pwc %>% add_xy_position(x = "group")
ggboxplot(PlantGrowth, x = "group", y = "weight") +
  stat_pvalue_manual(pwc, label = "p.adj", tip.length = 0, step.increase = 0.1) +
  labs(
    subtitle = get_test_label(res.aov, detailed = TRUE),
    caption = get_pwc_label(pwc)
    )
# Afficher les niveaux de significativité
# Cacher les tests non significatifs
ggboxplot(PlantGrowth, x = "group", y = "weight") +
  stat_pvalue_manual(pwc, hide.ns = TRUE, label = "p.adj.signif") +
  labs(
    subtitle = get_test_label(res.aov, detailed = TRUE),
    caption = get_pwc_label(pwc)
    )
Version:
 English


No Comments