Description
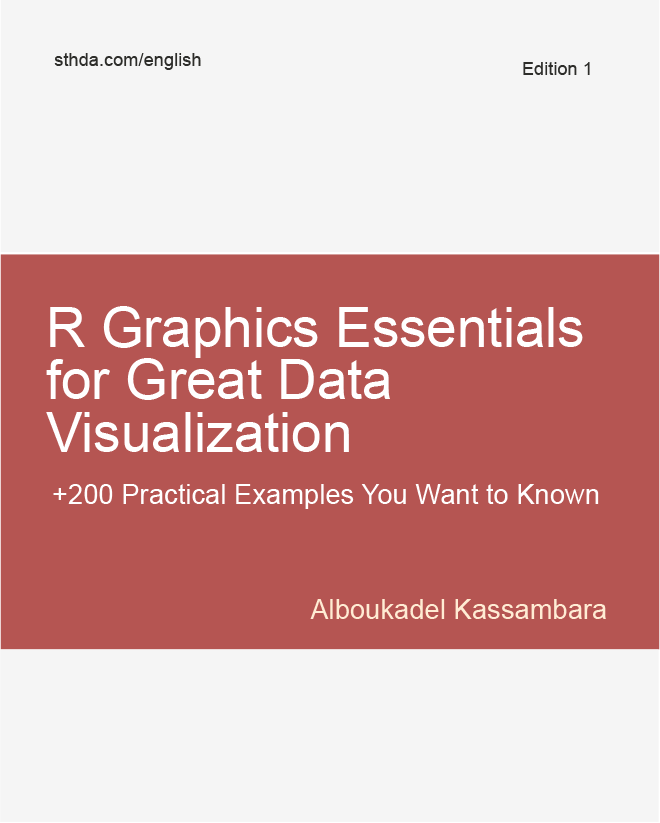
Data visualization is one of the most important part of data science. Many books and courses present a catalogue of graphics but they don't teach you which charts to use according to the type of the data.
In this book, we start by presenting the key graphic systems and packages available in R, including R base graphs, lattice and ggplot2 plotting systems.
Next, we provide practical examples to create great graphics for the right data using either the ggplot2 package and extensions or the traditional R graphics.
With this book, you 'll learn:
- How to quickly create beautiful graphics using ggplot2 packages
- How to properly customize and annotate the plots
- Type of graphics for visualizing categorical and continuous variables
- How to add automatically p-values to box plots, bar plots and alternatives
- How to add marginal density plots and correlation coefficients to scatter plots
- Key methods for analyzing and visualizing multivariate data
- R functions and packages for plotting time series data
- How to combine multiple plots on one page to create production-quality figures.
Recommended for you
This section contains best data science and self-development resources to help you on your path.
Books - Data Science
Our Books
- Practical Guide to Cluster Analysis in R by A. Kassambara (Datanovia)
- Practical Guide To Principal Component Methods in R by A. Kassambara (Datanovia)
- Machine Learning Essentials: Practical Guide in R by A. Kassambara (Datanovia)
- R Graphics Essentials for Great Data Visualization by A. Kassambara (Datanovia)
- GGPlot2 Essentials for Great Data Visualization in R by A. Kassambara (Datanovia)
- Network Analysis and Visualization in R by A. Kassambara (Datanovia)
- Practical Statistics in R for Comparing Groups: Numerical Variables by A. Kassambara (Datanovia)
- Inter-Rater Reliability Essentials: Practical Guide in R by A. Kassambara (Datanovia)
Others
- R for Data Science: Import, Tidy, Transform, Visualize, and Model Data by Hadley Wickham & Garrett Grolemund
- Hands-On Machine Learning with Scikit-Learn, Keras, and TensorFlow: Concepts, Tools, and Techniques to Build Intelligent Systems by Aurelien Géron
- Practical Statistics for Data Scientists: 50 Essential Concepts by Peter Bruce & Andrew Bruce
- Hands-On Programming with R: Write Your Own Functions And Simulations by Garrett Grolemund & Hadley Wickham
- An Introduction to Statistical Learning: with Applications in R by Gareth James et al.
- Deep Learning with R by François Chollet & J.J. Allaire
- Deep Learning with Python by François Chollet
Version:
 Français


20 reviews for R Graphics Essentials for Great Data Visualization
There are no reviews yet.