Les codes R sont fournis pour créer un beau box plot dans R avec un tableau des statistiques descriptives sous le graphique.
# Charger les packages R requis
library(ggpubr)

# Préparation des données
df <- ToothGrowth
head(df)
## len supp dose
## 1 4.2 VC 0.5
## 2 11.5 VC 0.5
## 3 7.3 VC 0.5
## 4 5.8 VC 0.5
## 5 6.4 VC 0.5
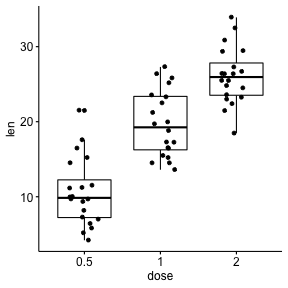
## 6 10.0 VC 0.5# Créer un box plot basic
ggboxplot(df, x = "dose", y = "len", add = "jitter")
# Créer un box plot avec un tableau descriptif
ggsummarystats(
  df, x = "dose", y = "len", add = "jitter",
  color = "supp", palette = "npg",
  ggfunc = ggboxplot
)
Version:
 English


No Comments