
Cet article décrit comment installer ggplot2 dans R.
Sommaire:
Livre Apparenté
GGPLOT2 - L’Essentiel pour une Visualisation Magnifique des Données dans RInstallation de ggplot2
Le package ggplot2 peut être facilement installé à l’aide de la fonction R install.packages().
Vous devez taper le code R suivant dans la console:
install.packages("ggplot2")Le code ci-dessus téléchargera automatiquement le package ggplot2, depuis le dépôt CRAN (Comprehensive R Archive Network), et l’installera.
Utilisation de ggplot2
Après avoir installé le package, vous pouvez le charger à l’aide de la fonction R library().
# Charger ggplot2
library("ggplot2")

# Créer un nuage de points
ggplot(iris, aes(x = Sepal.Length, y = Sepal.Width)) +
  geom_point(aes(color = Species)) +
  scale_color_viridis_d() +
  theme_minimal()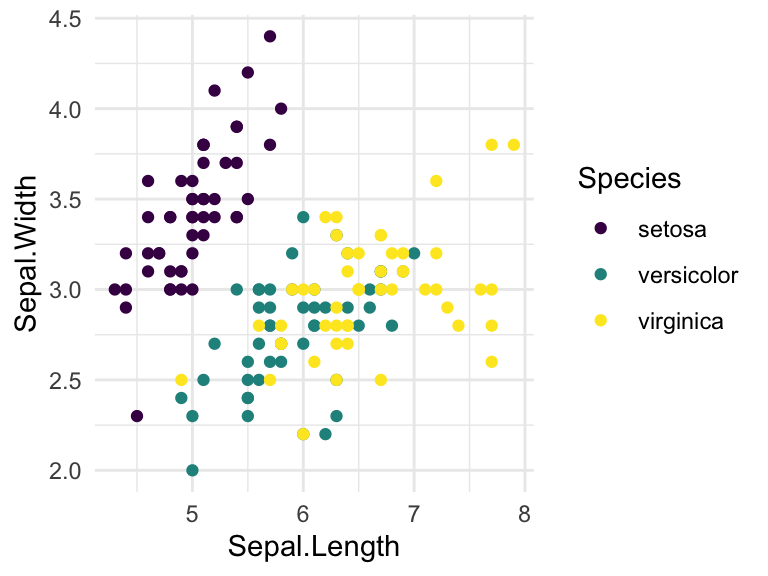
Version:
 English


No Comments