
This article describes how to install ggplot2 in R.
Related Book
GGPlot2 Essentials for Great Data Visualization in RInstalling ggplot2
The ggplot2 package can be easily installed using the R function install.packages().
You need to type the following R code in the console:
install.packages("ggplot2")The above code will automatically download the ggplot2 package, from the CRAN (Comprehensive R Archive Network) repository, and install it.
Using ggplot2
After installing the package, you can load it using the R function library().
# Load ggplot2
library("ggplot2")

# Create a scatter plot
ggplot(iris, aes(x = Sepal.Length, y = Sepal.Width)) +
  geom_point(aes(color = Species)) +
  scale_color_viridis_d() +
  theme_minimal()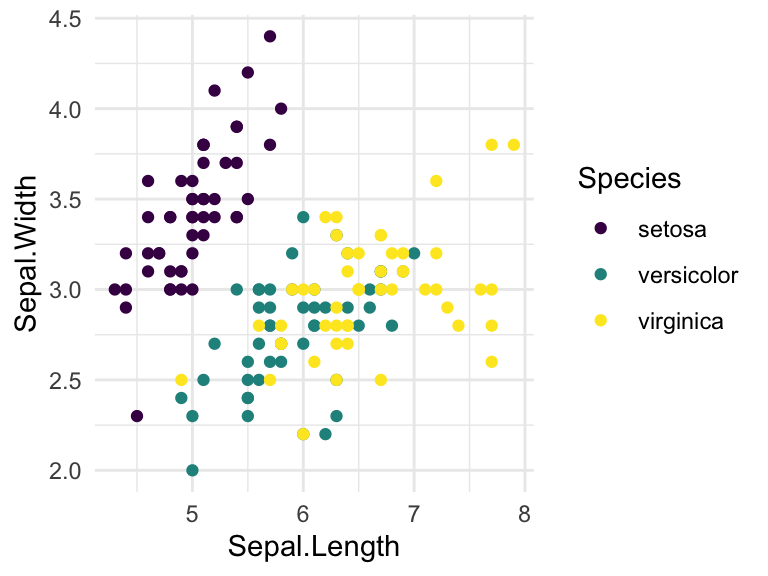
Recommended for you
This section contains best data science and self-development resources to help you on your path.
Books - Data Science
Our Books
- Practical Guide to Cluster Analysis in R by A. Kassambara (Datanovia)
- Practical Guide To Principal Component Methods in R by A. Kassambara (Datanovia)
- Machine Learning Essentials: Practical Guide in R by A. Kassambara (Datanovia)
- R Graphics Essentials for Great Data Visualization by A. Kassambara (Datanovia)
- GGPlot2 Essentials for Great Data Visualization in R by A. Kassambara (Datanovia)
- Network Analysis and Visualization in R by A. Kassambara (Datanovia)
- Practical Statistics in R for Comparing Groups: Numerical Variables by A. Kassambara (Datanovia)
- Inter-Rater Reliability Essentials: Practical Guide in R by A. Kassambara (Datanovia)
Others
- R for Data Science: Import, Tidy, Transform, Visualize, and Model Data by Hadley Wickham & Garrett Grolemund
- Hands-On Machine Learning with Scikit-Learn, Keras, and TensorFlow: Concepts, Tools, and Techniques to Build Intelligent Systems by Aurelien Géron
- Practical Statistics for Data Scientists: 50 Essential Concepts by Peter Bruce & Andrew Bruce
- Hands-On Programming with R: Write Your Own Functions And Simulations by Garrett Grolemund & Hadley Wickham
- An Introduction to Statistical Learning: with Applications in R by Gareth James et al.
- Deep Learning with R by François Chollet & J.J. Allaire
- Deep Learning with Python by François Chollet
Version:
 Français


No Comments