This tutorial introduces how to easily compute statistcal summaries in R using the dplyr package.
You will learn, how to:
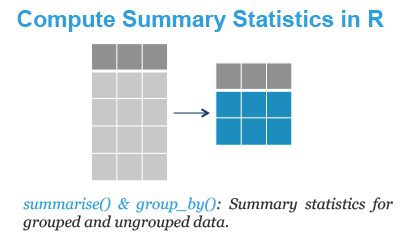
- Compute summary statistics for ungrouped data, as well as, for data that are grouped by one or multiple variables. R functions: summarise() and group_by().
- Summarise multiple variable columns. R functions:
- summarise_all(): apply summary functions to every columns in the data frame.
- summarise_at(): apply summary functions to specific columns selected with a character vector
- summarise_if(): apply summary functions to columns selected with a predicate function that returns TRUE.
Contents:
Required packages
Load the tidyverse packages, which include dplyr:
library(tidyverse)Demo dataset
We’ll use the R built-in iris data set, which we start by converting into a tibble data frame (tbl_df) for easier data analysis.
my_data <- as_tibble(iris)
my_data
## # A tibble: 150 x 5
## Sepal.Length Sepal.Width Petal.Length Petal.Width Species
## <dbl> <dbl> <dbl> <dbl> <fct>
## 1 5.1 3.5 1.4 0.2 setosa
## 2 4.9 3 1.4 0.2 setosa
## 3 4.7 3.2 1.3 0.2 setosa
## 4 4.6 3.1 1.5 0.2 setosa
## 5 5 3.6 1.4 0.2 setosa
## 6 5.4 3.9 1.7 0.4 setosa
## # ... with 144 more rowsSummary statistics of ungrouped data
Compute the mean of Sepal.Length and Petal.Length as well as the number of observations using the function n():
my_data %>%
  summarise(
          count = n(),
          mean_sep = mean(Sepal.Length, na.rm = TRUE),
          mean_pet = mean(Petal.Length, na.rm = TRUE)
          )
## # A tibble: 1 x 3
## count mean_sep mean_pet
## <int> <dbl> <dbl>
## 1 150 5.84 3.76Note that, we used the additional argument na.rm to remove NAs, before computing means.
Summary statistics of grouped data
Key R functions: group_by() and summarise()
Group by one variable
my_data %>%
  group_by(Species) %>%
  summarise(
          count = n(),
          mean_sep = mean(Sepal.Length),
          mean_pet = mean(Petal.Length)
            )
## # A tibble: 3 x 4
## Species count mean_sep mean_pet
## <fct> <int> <dbl> <dbl>
## 1 setosa 50 5.01 1.46
## 2 versicolor 50 5.94 4.26
## 3 virginica 50 6.59 5.55Note that, it’s possible to combine multiple operations using the maggrittr forward-pipe operator : %>%. For example, x %>% f is equivalent to f(x).
In the R code above:
- first, my_data is passed to group_by() function
- next, the output of group_by() is passed to summarise() function
Group by multiple variables
# ToothGrowth demo data sets
head(ToothGrowth)
## len supp dose
## 1 4.2 VC 0.5
## 2 11.5 VC 0.5
## 3 7.3 VC 0.5
## 4 5.8 VC 0.5
## 5 6.4 VC 0.5
## 6 10.0 VC 0.5# Summarize
ToothGrowth %>%
group_by(supp, dose) %>%
summarise(
n = n(),
mean = mean(len),
sd = sd(len)
)## # A tibble: 6 x 5
## # Groups: supp [?]
## supp dose n mean sd
## <fct> <dbl> <int> <dbl> <dbl>
## 1 OJ 0.5 10 13.2 4.46
## 2 OJ 1 10 22.7 3.91
## 3 OJ 2 10 26.1 2.66
## 4 VC 0.5 10 7.98 2.75
## 5 VC 1 10 16.8 2.52
## 6 VC 2 10 26.1 4.80Summarise multiple variables
Key R functions
The functions summarise_all(), summarise_at() and summarise_if() can be used to summarise multiple columns at once.
The simplified formats are as follow:
summarise_all(.tbl, .funs, ...)
summarise_if(.tbl, .predicate, .funs, ...)
summarise_at(.tbl, .vars, .funs, ...)- .tbl: a tbl data frame
- .funs: List of function calls generated by
funs(), or a character vector of function names, or simply a function. - …: Additional arguments for the function calls in .funs.
- .predicate: A predicate function to be applied to the columns or a logical vector. The variables for which .predicate is or returns TRUE are selected.
Summarise variables
- Summarise all variables - compute the mean of all variables:
my_data %>%
  group_by(Species) %>%
  summarise_all(mean)
## # A tibble: 3 x 5
## Species Sepal.Length Sepal.Width Petal.Length Petal.Width
## <fct> <dbl> <dbl> <dbl> <dbl>
## 1 setosa 5.01 3.43 1.46 0.246
## 2 versicolor 5.94 2.77 4.26 1.33
## 3 virginica 6.59 2.97 5.55 2.03- Summarise specific variables selected with a character vector:
my_data %>%
  group_by(Species) %>%
summarise_at(c("Sepal.Length", "Sepal.Width"), mean, na.rm = TRUE)- Summarise specific variables selected with a predicate function:
my_data %>%
  group_by(Species) %>%
  summarise_if(is.numeric, mean, na.rm = TRUE)
Useful statistical summary functions
This section presents some R functions for computing statistical summaries.
Measure of location:
- mean(x): sum of x divided by the length
- median(x): 50% of x is above and 50% is below
Measure of variation:
- sd(x): standard deviation
- IQR(x): interquartile range (robust equivalent of sd when outliers are present in the data)
- mad(x): median absolute deviation (robust equivalent of sd when outliers are present in the data)
Measure of rank:
- min(x): minimum value of x
- max(x): maximum value of x
- quantile(x, 0.25): 25% of x is below this value
Measure of position:
- first(x): equivalent to x[1]
- nth(x, 2): equivalent to n<-2; x[n]
- last(x): equivalent to x[length(x)]
Counts:
- n(x): the number of element in x
- sum(!is.na(x)): count non-missing values
- n_distinct(x): count the number of unique value
Counts and proportions of logical values:
- sum(x > 10): count the number of elements where x > 10
- mean(y == 0): proportion of elements where y = 0
Summary
In this tutorial, we describe how to easily compute statistical summaries using the R functions summarise() and group_by() [in dplyr package].
Recommended for you
This section contains best data science and self-development resources to help you on your path.
Books - Data Science
Our Books
- Practical Guide to Cluster Analysis in R by A. Kassambara (Datanovia)
- Practical Guide To Principal Component Methods in R by A. Kassambara (Datanovia)
- Machine Learning Essentials: Practical Guide in R by A. Kassambara (Datanovia)
- R Graphics Essentials for Great Data Visualization by A. Kassambara (Datanovia)
- GGPlot2 Essentials for Great Data Visualization in R by A. Kassambara (Datanovia)
- Network Analysis and Visualization in R by A. Kassambara (Datanovia)
- Practical Statistics in R for Comparing Groups: Numerical Variables by A. Kassambara (Datanovia)
- Inter-Rater Reliability Essentials: Practical Guide in R by A. Kassambara (Datanovia)
Others
- R for Data Science: Import, Tidy, Transform, Visualize, and Model Data by Hadley Wickham & Garrett Grolemund
- Hands-On Machine Learning with Scikit-Learn, Keras, and TensorFlow: Concepts, Tools, and Techniques to Build Intelligent Systems by Aurelien Géron
- Practical Statistics for Data Scientists: 50 Essential Concepts by Peter Bruce & Andrew Bruce
- Hands-On Programming with R: Write Your Own Functions And Simulations by Garrett Grolemund & Hadley Wickham
- An Introduction to Statistical Learning: with Applications in R by Gareth James et al.
- Deep Learning with R by François Chollet & J.J. Allaire
- Deep Learning with Python by François Chollet

Thank you teacher
this tutorial was very helpful.
thank you so much
Thank you! btw do you know how to save the summarized results in a datafame? I summarized means of many variables and the R console doesn’t show the results at once.