
Ce tutoriel montre comment ajouter un titre à un ggplot. La fonction labs() est utilisée.
Sommaire:
Livre Apparenté
GGPLOT2 - L’Essentiel pour une Visualisation Magnifique des Données dans RPrérequis
Charger les packages requis et définir la fonction thème theme_minimal() comme thème par défaut:
library(ggplot2) # Pour la visualisation des données
theme_set(theme_minimal())
Ajouter le titre, le sous-titre et la légende
# Graphique par défaut
library(ggplot2)
p <- ggplot(ToothGrowth, aes(x = factor(dose), y = len)) +
geom_boxplot()
print(p)
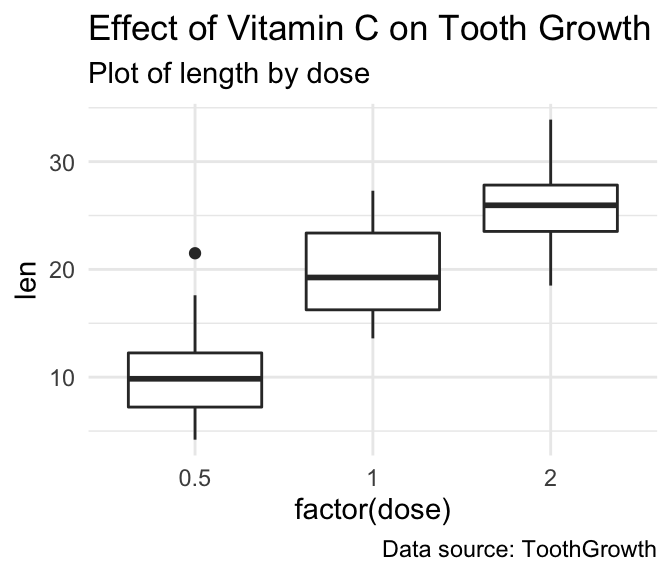
# Ajouter des titres
p <- p + labs(title = "Effect of Vitamin C on Tooth Growth",
subtitle = "Plot of length by dose",
caption = "Data source: ToothGrowth")
p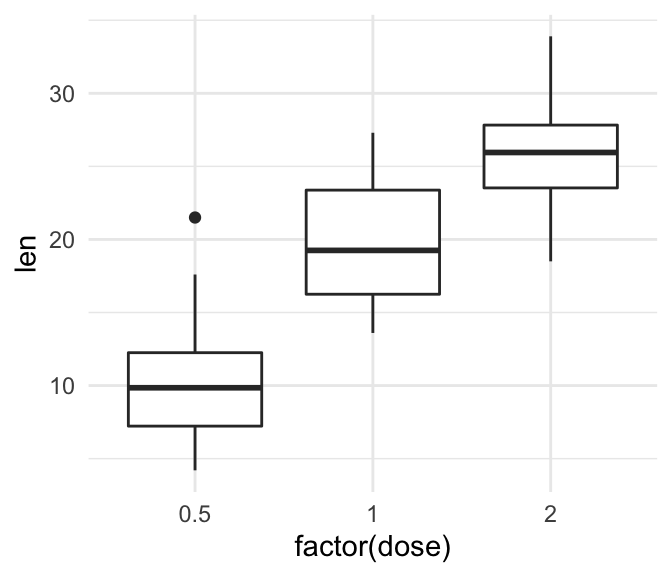
Version:
 English


No Comments