Clusters can be found in a data set by chance due to clustering noise or sampling error. This article describes the R package pvclust (Suzuki and Shimodaira 2015) which uses bootstrap resampling techniques to compute p-value for each hierarchical clusters.
Contents:
Related Book
Practical Guide to Cluster Analysis in RAlgorithm
- Generated thousands of bootstrap samples by randomly sampling elements of the data
- Compute hierarchical clustering on each bootstrap copy
- For each cluster:
- compute the bootstrap probability (BP) value which corresponds to the frequency that the cluster is identified in bootstrap copies.
- Compute the approximately unbiased (AU) probability values (p-values) by multiscale bootstrap resampling
Clusters with AU >= 95% are considered to be strongly supported by data.
Required packages
- Install pvclust:
install.packages("pvclust")- Load pvclust:
library(pvclust)Data preparation
We’ll use lung data set [in pvclust package]. It contains the gene expression profile of 916 genes of 73 lung tissues including 67 tumors. Columns are samples and rows are genes.
library(pvclust)
# Load the data
data("lung")
head(lung[, 1:4])
## fetal_lung 232-97_SCC 232-97_node 68-96_Adeno
## IMAGE:196992 -0.40 4.28 3.68 -1.35
## IMAGE:587847 -2.22 5.21 4.75 -0.91
## IMAGE:1049185 -1.35 -0.84 -2.88 3.35
## IMAGE:135221 0.68 0.56 -0.45 -0.20
## IMAGE:298560 NA 4.14 3.58 -0.40
## IMAGE:119882 -3.23 -2.84 -2.72 -0.83# Dimension of the data
dim(lung)## [1] 916 73We’ll use only a subset of the data set for the clustering analysis. The R function sample() can be used to extract a random subset of 30 samples:
set.seed(123)
ss <- sample(1:73, 30) # extract 20 samples out of
df <- lung[, ss]
Compute p-value for hierarchical clustering
Description of pvclust() function
The function pvclust() can be used as follow:
pvclust(data, method.hclust = "average",
        method.dist = "correlation", nboot = 1000)
Note that, the computation time can be strongly decreased using parallel computation version called parPvclust(). (Read ?parPvclust() for more information.)
parPvclust(cl=NULL, data, method.hclust = "average",
           method.dist = "correlation", nboot = 1000,
iseed = NULL)- data: numeric data matrix or data frame.
- method.hclust: the agglomerative method used in hierarchical clustering. Possible values are one of “average”, “ward”, “single”, “complete”, “mcquitty”, “median” or “centroid”. The default is “average”. See method argument in ?hclust.
- method.dist: the distance measure to be used. Possible values are one of “correlation”, “uncentered”, “abscor” or those which are allowed for method argument in dist() function, such “euclidean” and “manhattan”.
- nboot: the number of bootstrap replications. The default is 1000.
- iseed: an integrer for random seeds. Use iseed argument to achieve reproducible results.
The function pvclust() returns an object of class pvclust containing many elements including hclust which contains hierarchical clustering result for the original data generated by the function hclust().
Usage of pvclust() function
pvclust() performs clustering on the columns of the data set, which correspond to samples in our case. If you want to perform the clustering on the variables (here, genes) you have to transpose the data set using the function t().
The R code below computes pvclust() using 10 as the number of bootstrap replications (for speed):
library(pvclust)
set.seed(123)
res.pv <- pvclust(df, method.dist="cor",
                  method.hclust="average", nboot = 10)
# Default plot
plot(res.pv, hang = -1, cex = 0.5)
pvrect(res.pv)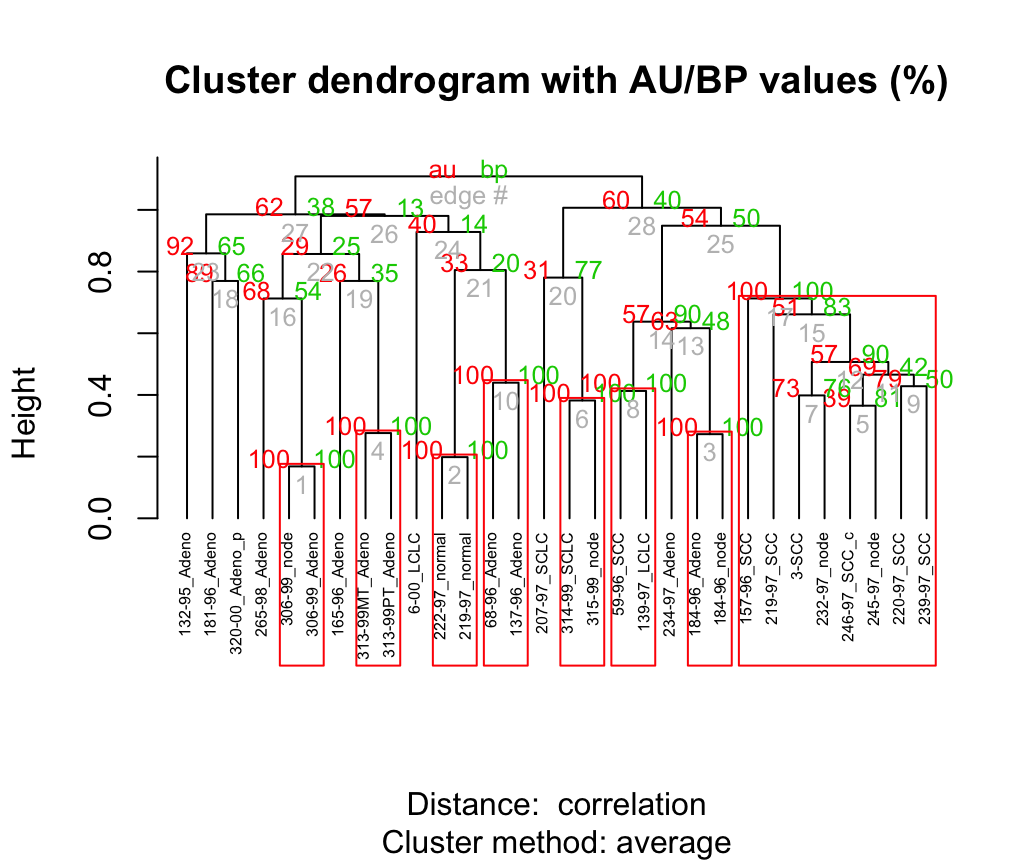
Values on the dendrogram are AU p-values (Red, left), BP values (green, right), and clusterlabels (grey, bottom). Clusters with AU > = 95% are indicated by the rectangles and are considered to be strongly supported by data.
To extract the objects from the significant clusters, use the function pvpick():
clusters <- pvpick(res.pv)
clusters
Parallel computation can be applied as follow:
# Create a parallel socket cluster
library(parallel)
cl <- makeCluster(2, type = "PSOCK")
# parallel version of pvclust
res.pv <- parPvclust(cl, df, nboot=1000)
stopCluster(cl)
References
Suzuki, Ryota, and Hidetoshi Shimodaira. 2015. Pvclust: Hierarchical Clustering with P-Values via Multiscale Bootstrap Resampling. https://CRAN.R-project.org/package=pvclust.
Recommended for you
This section contains best data science and self-development resources to help you on your path.
Books - Data Science
Our Books
- Practical Guide to Cluster Analysis in R by A. Kassambara (Datanovia)
- Practical Guide To Principal Component Methods in R by A. Kassambara (Datanovia)
- Machine Learning Essentials: Practical Guide in R by A. Kassambara (Datanovia)
- R Graphics Essentials for Great Data Visualization by A. Kassambara (Datanovia)
- GGPlot2 Essentials for Great Data Visualization in R by A. Kassambara (Datanovia)
- Network Analysis and Visualization in R by A. Kassambara (Datanovia)
- Practical Statistics in R for Comparing Groups: Numerical Variables by A. Kassambara (Datanovia)
- Inter-Rater Reliability Essentials: Practical Guide in R by A. Kassambara (Datanovia)
Others
- R for Data Science: Import, Tidy, Transform, Visualize, and Model Data by Hadley Wickham & Garrett Grolemund
- Hands-On Machine Learning with Scikit-Learn, Keras, and TensorFlow: Concepts, Tools, and Techniques to Build Intelligent Systems by Aurelien Géron
- Practical Statistics for Data Scientists: 50 Essential Concepts by Peter Bruce & Andrew Bruce
- Hands-On Programming with R: Write Your Own Functions And Simulations by Garrett Grolemund & Hadley Wickham
- An Introduction to Statistical Learning: with Applications in R by Gareth James et al.
- Deep Learning with R by François Chollet & J.J. Allaire
- Deep Learning with Python by François Chollet

No Comments