This tutorial describes how to subset or extract data frame rows based on certain criteria.
In this tutorial, you will learn the following R functions from the dplyr package:
- slice(): Extract rows by position
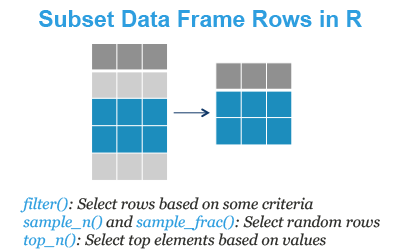
- filter(): Extract rows that meet a certain logical criteria. For example
iris %>% filter(Sepal.Length > 6). - filter_all(), filter_if() and filter_at(): filter rows within a selection of variables. These functions replicate the logical criteria over all variables or a selection of variables.
- sample_n(): Randomly select n rows
- sample_frac(): Randomly select a fraction of rows
- top_n(): Select top n rows ordered by a variable
We will also show you how to remove rows with missing values in a given column.
Contents:
Required packages
Load the tidyverse packages, which include dplyr:
library(tidyverse)Demo dataset
We’ll use the R built-in iris data set, which we start by converting into a tibble data frame (tbl_df) for easier data analysis.
my_data <- as_tibble(iris)
my_data
## # A tibble: 150 x 5
## Sepal.Length Sepal.Width Petal.Length Petal.Width Species
## <dbl> <dbl> <dbl> <dbl> <fct>
## 1 5.1 3.5 1.4 0.2 setosa
## 2 4.9 3 1.4 0.2 setosa
## 3 4.7 3.2 1.3 0.2 setosa
## 4 4.6 3.1 1.5 0.2 setosa
## 5 5 3.6 1.4 0.2 setosa
## 6 5.4 3.9 1.7 0.4 setosa
## # ... with 144 more rowsExtract rows by position
- Key R function:
slice()[dplyr package]
my_data %>% slice(1:6)Filter rows by logical criteria
- Key R function:
filter()[dplyr package]. Used to filter rows that meet some logical criteria.
Before continuing, we introduce logical comparisons and operators, which are important to know for filtering data.
Logical comparisons
The “logical” comparison operators available in R are:
- Logical comparisons
- <: for less than
- >: for greater than
- <=: for less than or equal to
- >=: for greater than or equal to
- ==: for equal to each other
- !=: not equal to each other
- %in%: group membership. For example, “value %in% c(2, 3)” means that value can takes 2 or 3.
- is.na(): is NA
- !is.na(): is not NA.
- Logical operators
- value == 2|3: means that the value equal 2 or (|) 3. value %in% c(2, 3) is a shortcut equivalent to value == 2|3.
- &: means and. For example sex == “female” & age > 25
The most frequent mistake made by beginners in R is to use = instead of == when testing for equality. Remember that, when you are testing for equality, you should always use == (not =).
Extract rows based on logical criteria
- One-column based criteria: Extract rows where Sepal.Length > 7:
my_data %>% filter(Sepal.Length > 7)## # A tibble: 12 x 5
## Sepal.Length Sepal.Width Petal.Length Petal.Width Species
## <dbl> <dbl> <dbl> <dbl> <fct>
## 1 7.1 3 5.9 2.1 virginica
## 2 7.6 3 6.6 2.1 virginica
## 3 7.3 2.9 6.3 1.8 virginica
## 4 7.2 3.6 6.1 2.5 virginica
## 5 7.7 3.8 6.7 2.2 virginica
## 6 7.7 2.6 6.9 2.3 virginica
## # ... with 6 more rows- Multiple-column based criteria: Extract rows where Sepal.Length > 6.7 and Sepal.Width ≤ 3:
my_data %>% filter(Sepal.Length > 6.7, Sepal.Width <= 3)## # A tibble: 10 x 5
## Sepal.Length Sepal.Width Petal.Length Petal.Width Species
## <dbl> <dbl> <dbl> <dbl> <fct>
## 1 6.8 2.8 4.8 1.4 versicolor
## 2 7.1 3 5.9 2.1 virginica
## 3 7.6 3 6.6 2.1 virginica
## 4 7.3 2.9 6.3 1.8 virginica
## 5 6.8 3 5.5 2.1 virginica
## 6 7.7 2.6 6.9 2.3 virginica
## # ... with 4 more rows- Test for equality (==): Extract rows where Sepal.Length > 6.5 and Species = “versicolor”:
my_data %>% filter(Sepal.Length > 6.7, Species == "versicolor")## # A tibble: 3 x 5
## Sepal.Length Sepal.Width Petal.Length Petal.Width Species
## <dbl> <dbl> <dbl> <dbl> <fct>
## 1 7 3.2 4.7 1.4 versicolor
## 2 6.9 3.1 4.9 1.5 versicolor
## 3 6.8 2.8 4.8 1.4 versicolor- Using OR operator (|): Extract rows where Sepal.Length > 6.5 and (Species = “versicolor” or Species = “virginica”):
Use this:
my_data %>% filter(
  Sepal.Length > 6.7,
  Species == "versicolor" | Species == "virginica"
  )
## # A tibble: 20 x 5
## Sepal.Length Sepal.Width Petal.Length Petal.Width Species
## <dbl> <dbl> <dbl> <dbl> <fct>
## 1 7 3.2 4.7 1.4 versicolor
## 2 6.9 3.1 4.9 1.5 versicolor
## 3 6.8 2.8 4.8 1.4 versicolor
## 4 7.1 3 5.9 2.1 virginica
## 5 7.6 3 6.6 2.1 virginica
## 6 7.3 2.9 6.3 1.8 virginica
## # ... with 14 more rowsOr, equivalently, use this shortcut (%in% operator):
my_data %>% filter(
  Sepal.Length > 6.7,
  Species %in% c("versicolor", "virginica" )
  )
Filter rows within a selection of variables
This section presents 3 functions - filter_all(), filter_if() and filter_at() - to filter rows within a selection of variables.
These functions replicate the logical criteria over all variables or a selection of variables.
Create a new demo data set from my_data by removing the grouping column “Species”:
my_data2 <- my_data %>% select(-Species)- Select rows where all variables are greater than 2.4:
my_data2 %>% filter_all(all_vars(.> 2.4))## # A tibble: 3 x 4
## Sepal.Length Sepal.Width Petal.Length Petal.Width
## <dbl> <dbl> <dbl> <dbl>
## 1 6.3 3.3 6 2.5
## 2 7.2 3.6 6.1 2.5
## 3 6.7 3.3 5.7 2.5- Select rows when any of the variables are greater than 2.4:
my_data2 %>% filter_all(any_vars(.> 2.4))## # A tibble: 150 x 4
## Sepal.Length Sepal.Width Petal.Length Petal.Width
## <dbl> <dbl> <dbl> <dbl>
## 1 5.1 3.5 1.4 0.2
## 2 4.9 3 1.4 0.2
## 3 4.7 3.2 1.3 0.2
## 4 4.6 3.1 1.5 0.2
## 5 5 3.6 1.4 0.2
## 6 5.4 3.9 1.7 0.4
## # ... with 144 more rows- Vary the selection of columns on which to apply the filtering criteria.
filter_at()takes avars()specification. The following R code apply the filtering criteria on the columns Sepal.Length and Sepal.Width:
my_data2 %>% filter_at(vars(starts_with("Sepal")), any_vars(. > 2.4))## # A tibble: 150 x 4
## Sepal.Length Sepal.Width Petal.Length Petal.Width
## <dbl> <dbl> <dbl> <dbl>
## 1 5.1 3.5 1.4 0.2
## 2 4.9 3 1.4 0.2
## 3 4.7 3.2 1.3 0.2
## 4 4.6 3.1 1.5 0.2
## 5 5 3.6 1.4 0.2
## 6 5.4 3.9 1.7 0.4
## # ... with 144 more rowsRemove missing values
We start by creating a data frame with missing values. In R NA (Not Available) is used to represent missing values:
# Create a data frame with missing data
friends_data <- data_frame(
  name = c("A", "B", "C", "D"),
  age = c(27, 25, 29, 26),
  height = c(180, NA, NA, 169),
  married = c("yes", "yes", "no", "no")
)
# Print
friends_data
## # A tibble: 4 x 4
## name age height married
## <chr> <dbl> <dbl> <chr>
## 1 A 27 180 yes
## 2 B 25 NA yes
## 3 C 29 NA no
## 4 D 26 169 noExtract rows where height is NA:
friends_data %>% filter(is.na(height))## # A tibble: 2 x 4
## name age height married
## <chr> <dbl> <dbl> <chr>
## 1 B 25 NA yes
## 2 C 29 NA noExclude (drop) rows where height is NA:
friends_data %>% filter(!is.na(height))## # A tibble: 2 x 4
## name age height married
## <chr> <dbl> <dbl> <chr>
## 1 A 27 180 yes
## 2 D 26 169 noIn the R code above, !is.na() means that “we don’t want” NAs.
Select random rows from a data frame
It’s possible to select either n random rows with the function sample_n() or a random fraction of rows with sample_frac(). We first use the function set.seed() to initiate random number generator engine. This important for users to reproduce the analysis.
set.seed(1234)
# Extract 5 random rows without replacement
my_data %>% sample_n(5, replace = FALSE)

# Extract 5% of rows, randomly without replacement
my_data %>% sample_frac(0.05, replace = FALSE)
Select top n rows ordered by a variable
Select the top 5 rows ordered by Sepal.Length
my_data %>% top_n(5, Sepal.Length)## # A tibble: 5 x 5
## Sepal.Length Sepal.Width Petal.Length Petal.Width Species
## <dbl> <dbl> <dbl> <dbl> <fct>
## 1 7.7 3.8 6.7 2.2 virginica
## 2 7.7 2.6 6.9 2.3 virginica
## 3 7.7 2.8 6.7 2 virginica
## 4 7.9 3.8 6.4 2 virginica
## 5 7.7 3 6.1 2.3 virginicaGroup by the column Species and select the top 5 of each group ordered by Sepal.Length:
my_data %>%
  group_by(Species) %>%
  top_n(5, Sepal.Length)
## # A tibble: 16 x 5
## # Groups: Species [3]
## Sepal.Length Sepal.Width Petal.Length Petal.Width Species
## <dbl> <dbl> <dbl> <dbl> <fct>
## 1 5.8 4 1.2 0.2 setosa
## 2 5.7 4.4 1.5 0.4 setosa
## 3 5.7 3.8 1.7 0.3 setosa
## 4 5.5 4.2 1.4 0.2 setosa
## 5 5.5 3.5 1.3 0.2 setosa
## 6 7 3.2 4.7 1.4 versicolor
## # ... with 10 more rowsSummary
In this tutorial, we introduce how to filter a data frame rows using the dplyr package:
- Filter rows by logical criteria:
my_data %>% filter(Sepal.Length >7) - Select n random rows:
my_data %>% sample_n(10) - Select a random fraction of rows:
my_data %>% sample_frac(10) - Select top n rows by values:
my_data %>% top_n(10, Sepal.Length)
Recommended for you
This section contains best data science and self-development resources to help you on your path.
Books - Data Science
Our Books
- Practical Guide to Cluster Analysis in R by A. Kassambara (Datanovia)
- Practical Guide To Principal Component Methods in R by A. Kassambara (Datanovia)
- Machine Learning Essentials: Practical Guide in R by A. Kassambara (Datanovia)
- R Graphics Essentials for Great Data Visualization by A. Kassambara (Datanovia)
- GGPlot2 Essentials for Great Data Visualization in R by A. Kassambara (Datanovia)
- Network Analysis and Visualization in R by A. Kassambara (Datanovia)
- Practical Statistics in R for Comparing Groups: Numerical Variables by A. Kassambara (Datanovia)
- Inter-Rater Reliability Essentials: Practical Guide in R by A. Kassambara (Datanovia)
Others
- R for Data Science: Import, Tidy, Transform, Visualize, and Model Data by Hadley Wickham & Garrett Grolemund
- Hands-On Machine Learning with Scikit-Learn, Keras, and TensorFlow: Concepts, Tools, and Techniques to Build Intelligent Systems by Aurelien Géron
- Practical Statistics for Data Scientists: 50 Essential Concepts by Peter Bruce & Andrew Bruce
- Hands-On Programming with R: Write Your Own Functions And Simulations by Garrett Grolemund & Hadley Wickham
- An Introduction to Statistical Learning: with Applications in R by Gareth James et al.
- Deep Learning with R by François Chollet & J.J. Allaire
- Deep Learning with Python by François Chollet

very good tutorial
Thank you for your positive feedback, highly appreciated
Thanks Man, really cleared everthin up
I suppose the top_n function to sort the rows in descending order.
If that’s correct, line 15 should be line 12 (since 7.9 > 7.7). See below.
Why isn’t it the case?
# A tibble: 16 x 5 # Groups: Species [3] Sepal.Length Sepal.Width Petal.Length Petal.Width Species 1 5.8 4 1.2 0.2 setosa 2 5.7 4.4 1.5 0.4 setosa 3 5.7 3.8 1.7 0.3 setosa 4 5.5 4.2 1.4 0.2 setosa 5 5.5 3.5 1.3 0.2 setosa 6 7 3.2 4.7 1.4 versicolor 7 6.9 3.1 4.9 1.5 versicolor 8 6.7 3.1 4.4 1.4 versicolor 9 6.8 2.8 4.8 1.4 versicolor 10 6.7 3 5 1.7 versicolor 11 6.7 3.1 4.7 1.5 versicolor 12 7.7 3.8 6.7 2.2 virginica 13 7.7 2.6 6.9 2.3 virginica 14 7.7 2.8 6.7 2 virginica 15 7.9 3.8 6.4 2 virginica 16 7.7 3 6.1 2.3 virginicaHi,
The top_n() function doesn’t sort the data, it only pick the top n based on a variable. For sorting, use the function arrange() and then the top_n().
Hi Kassambara,
This is very informative.
Could you please let me know how could I pick up distinct rows if the values of the rows are same?
Thanks & Regards,
Ashmeel.
Got it!
validCust %>% group_by(CUSTGRP) %>% top_n(1, AGE) %>% distinct(CUSTGRP, AGE)
Thanks! Your blog is informative.
It’s great that you find the answer to your question…
Thank you for the positive feedback! Highly appreciated
Hi, I have an off-topic question – from which place is the photo at the top of this site?
The photo at the top of the site is from the “Saint Andéol” lake (Aubrac, Lozére, France)
Hi!
great tutorial, my only problem is when I subset my data I loose the row.names in the new dataframe. How to I preserve that information?
In modern R programming (with tidyverse) each column should have a name.
Yu can transform your row names into a column for preserving them. The function `rownames_to_column()` can be used:
Thank you very much, that helped me a lot.
I can use top_on to extract the highest data from the data frame, what about the lowest one, which function should i use?
If n is positive, top_n() selects the top n rows. If negative, selects the bottom n rows.
Hi!
great tutorial, Very informative. Highly useful. Thanks a lot.