
Description
This R Statistics book provides a solid step-by-step practical guide to statistical inference for comparing groups means using the R software. Additionally, we developed an R package named rstatix (https://rpkgs.datanovia.com/rstatix/), which provides a simple and intuitive pipe-friendly framework, coherent with the tidyverse design philosophy, for computing the most common statistical analyses, including t-test, Wilcoxon test, ANOVA, Kruskal-Wallis and correlation analyses, outliers identification and more.
This book is designed to get you doing the statistical tests in R as quick as possible. The book focuses on implementation and understanding of the methods, without having to struggle through pages of mathematical proofs.
You will be guided through the steps of summarizing and visualizing the data, checking the assumptions and performing statistical tests in R, interpreting and reporting the results.
Key features of this book
Although there are several good books on statistics and related topics, we felt that many of them are too theoretical. Our goal was to write a practical guide to statistics in R with visualization, interpretation and reporting the results.
The main parts of the book include:
- statistical tests and assumptions for the comparison of groups means,
- comparing two means,
- t-test,
- Wilcoxon test,
- Sign test,
- comparing multiple means,
- ANOVA - Analysis of Variance for independent measures
- repeated measures ANOVA,
- mixed ANOVA,
- ANCOVA and MANOVA,
- Kruskal-Wallis test
- Friedman test
The book presents the basic principles of these tasks and provide many examples in R. This book offers solid guidance in statistics for students and researchers.
Key features:
- Covers the most common statistical tests and implementations
- Key assumptions are presented and checked
- Short, self-contained chapters with practical examples. This means that, you don’t need to read the different chapters in sequence.
In each chapter, we present R lab sections in which we systematically work through applications of the various methods discussed in that chapter.
How this book is organized ?
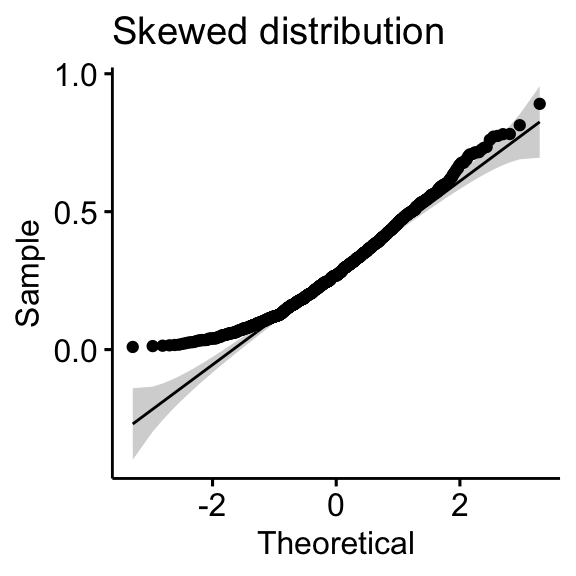
This book contains 3 parts. After a quick introduction to R (Chapter @ref(introduction-to-r)), Part I introduces some research questions and the corresponding statistical tests, as well as, the assumptions of the tests. Many of the statistical methods including t-test and analysis of variance (ANOVA) assume some characteristics about the data, including normality of the data distributions and equality of group variances. These assumptions should be taken seriously to draw reliable interpretation and conclusions of the research. In Part I, you will learn how to assess normality using the Shapiro-Wilk test (Chapter @ref(normality-test-in-r)) and how to compare variances in R using Levene’s test and more (Chapter @ref(homogeneity-of-variance)).
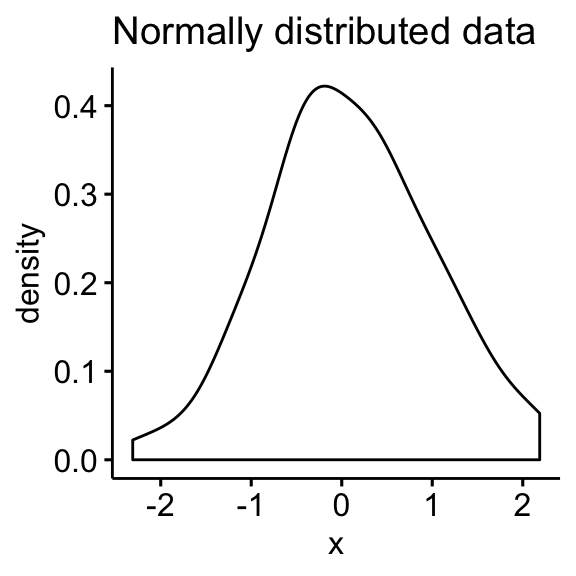
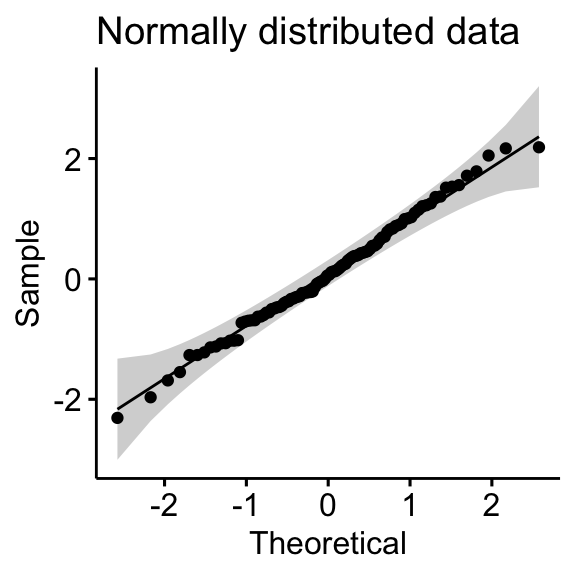
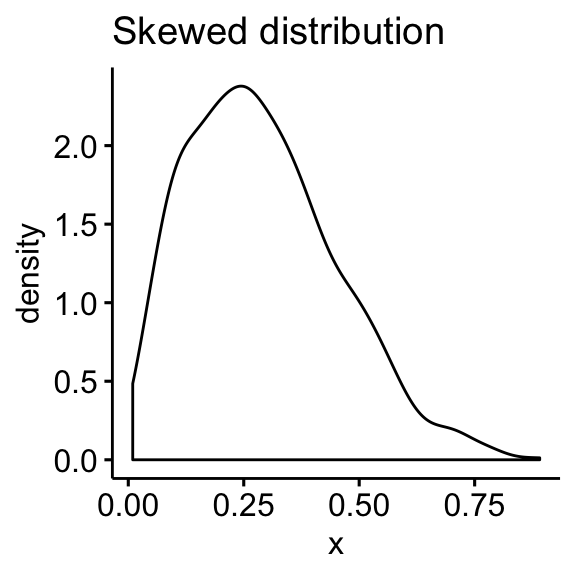
Examples of distribution shapes
- Normal distribution
- Skewed distributions
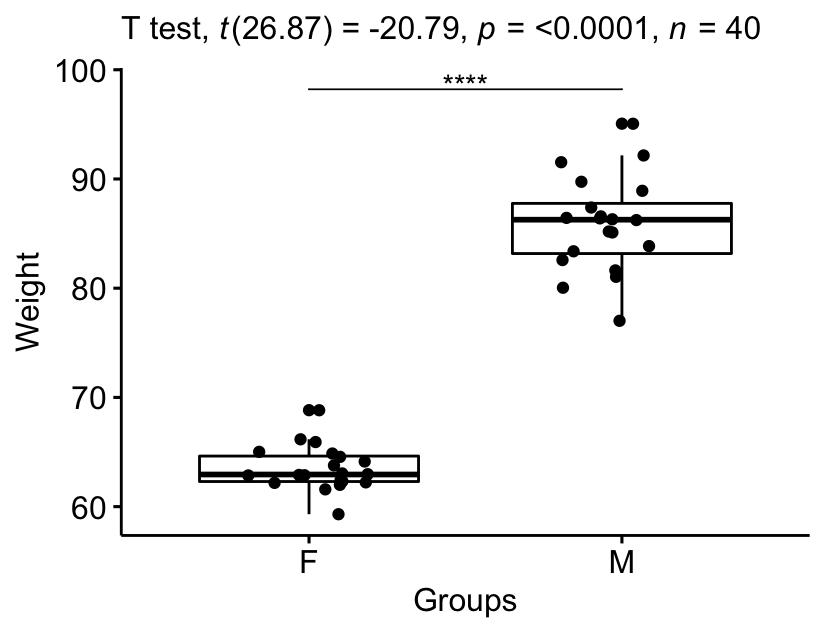
In Part II, we consider how to compare two means using t-test (parametric method, Chapter @ref(t-test)) and wilcoxon test (non-parametric method, Chapter @ref(wilcoxon-test)). Main contents, include:
- Comparing one-sample mean to a standard known mean:
- One-Sample T-test (parametric)
- Wilcoxon Signed Rank Test (non-parametric)
- Comparing the means of two independent groups:
- Independent Samples T-test (parametric)
- Wilcoxon Rank Sum Test (non-parametric)
- Comparing the means of paired samples:
- Paired Samples T-test (parametric)
- Wilcoxon Signed Rank Test on Paired Samples (non-parametric)
In this Part, we also described how to check t-test assumptions, as well as, how to compute the t-test effect size (Cohen’s d). You will also learn how to compute the Wilcoxon effect size. Additionally, we present the sign test (Chapter @ref(sign-test)), an alternative to the paired-samples t-test and the Wilcoxon signed-rank test, in the situation where the distribution of differences between paired data values is neither normal (in t-test) nor symmetrical (in Wilcoxon test).
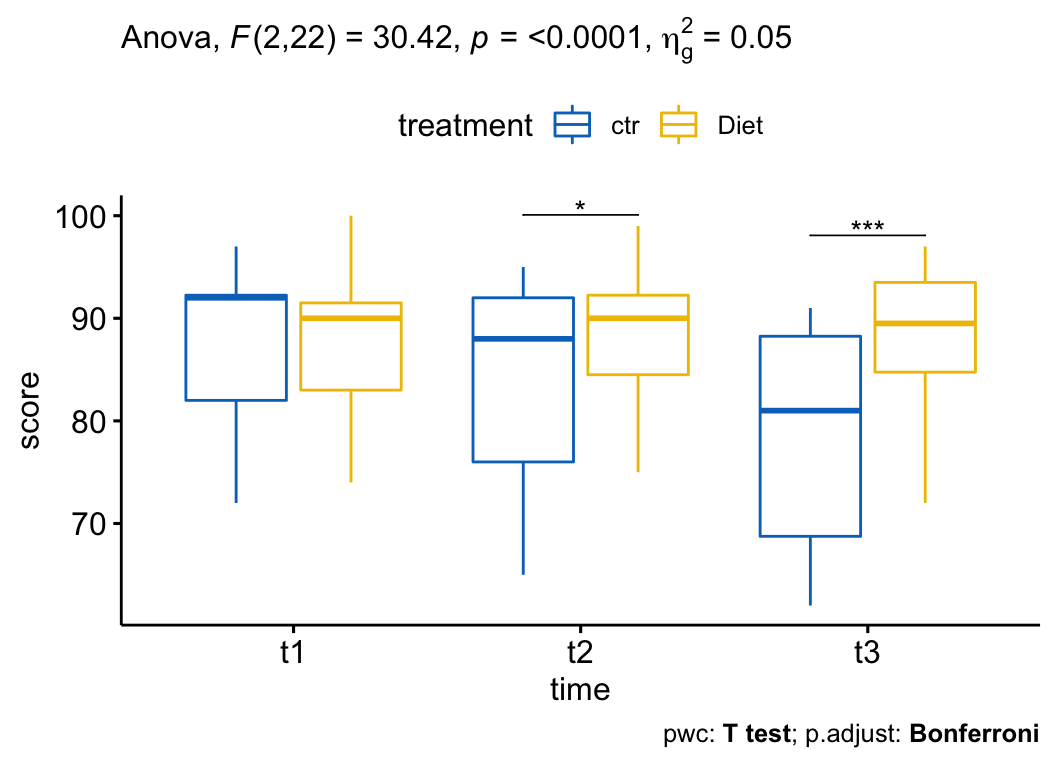
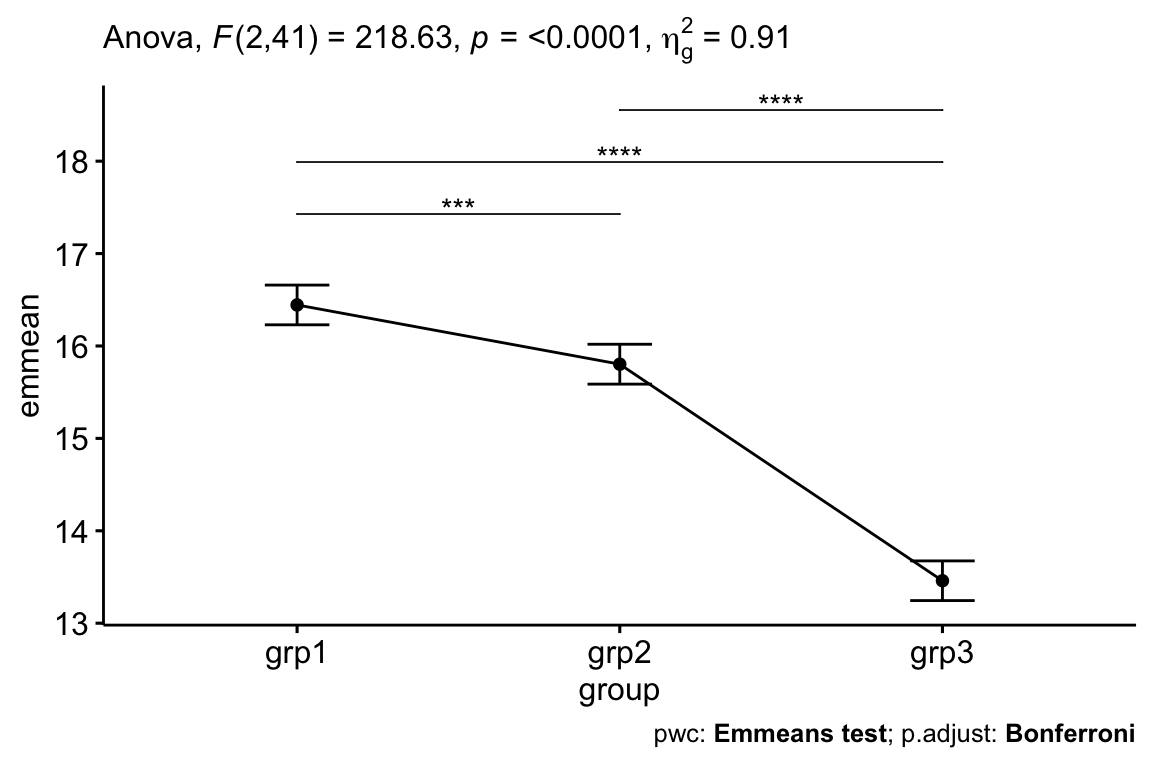
Part III describes how to compare multiple means in R using ANOVA (Analysis of Variance) method and variants (Chapters @ref(anova-analysis-of-variance) - @ref(friedman-test)).
Chapter @ref(anova-analysis-of-variance) describes how to compute and interpret the different types of ANOVA for comparing independent measures, including:
- One-way ANOVA, an extension of the independent samples t-test for comparing the means in a situation where there are more than two groups.
- two-way ANOVA for assessing an interaction effect between two independent categorical variables on a continuous outcome variable.
- three-way ANOVA for assessing an interaction effect between three independent categorical variables on a continuous outcome variable.
We also provide R code to check ANOVA assumptions and perform Post-Hoc analyses. Additionally, we’ll present the Kruskal-Wallis test (Chapter @ref(kruskal-wallis-test-in-r)), which is a non-parametric alternative to the one-way ANOVA test.

Chapter @ref(repeated-measure-anova) presents repeated-measures ANOVA, which is used for analyzing data where same subjects are measured more than once. You will learn different types of repeated measures ANOVA, including:
- One-way repeated measures ANOVA for comparing the means of three or more levels of a within-subjects variable.
- two-way repeated measures ANOVA used to evaluate simultaneously the effect of two within-subject factors on a continuous outcome variable.
- three-way repeated measures ANOVA used to evaluate simultaneously the effect of three within-subject factors on a continuous outcome variable.
You will also learn how to compute and interpret the Friedman test (Chapter @ref(friedman-test)), which is a non-parametric alternative to the one-way repeated measures ANOVA test.
Chapter @ref(mixed-anova) shows how to run mixed ANOVA, which is used to compare the means of groups cross-classified by at least two factors, where one factor is a “within-subjects” factor (repeated measures) and the other factor is a “between-subjects” factor.
Chapters @ref(ancova) and @ref(one-way-manova) describe, respectively, some advanced extensions of ANOVA, including:
- ANCOVA (analyse of covariance), an extension of the one-way ANOVA that incorporate a covariate variable.
- MANOVA (multivariate analysis of variance), an ANOVA with two or more continuous outcome variables.
Recommended for you
This section contains best data science and self-development resources to help you on your path.
Books - Data Science
Our Books
- Practical Guide to Cluster Analysis in R by A. Kassambara (Datanovia)
- Practical Guide To Principal Component Methods in R by A. Kassambara (Datanovia)
- Machine Learning Essentials: Practical Guide in R by A. Kassambara (Datanovia)
- R Graphics Essentials for Great Data Visualization by A. Kassambara (Datanovia)
- GGPlot2 Essentials for Great Data Visualization in R by A. Kassambara (Datanovia)
- Network Analysis and Visualization in R by A. Kassambara (Datanovia)
- Practical Statistics in R for Comparing Groups: Numerical Variables by A. Kassambara (Datanovia)
- Inter-Rater Reliability Essentials: Practical Guide in R by A. Kassambara (Datanovia)
Others
- R for Data Science: Import, Tidy, Transform, Visualize, and Model Data by Hadley Wickham & Garrett Grolemund
- Hands-On Machine Learning with Scikit-Learn, Keras, and TensorFlow: Concepts, Tools, and Techniques to Build Intelligent Systems by Aurelien Géron
- Practical Statistics for Data Scientists: 50 Essential Concepts by Peter Bruce & Andrew Bruce
- Hands-On Programming with R: Write Your Own Functions And Simulations by Garrett Grolemund & Hadley Wickham
- An Introduction to Statistical Learning: with Applications in R by Gareth James et al.
- Deep Learning with R by François Chollet & J.J. Allaire
- Deep Learning with Python by François Chollet
Version:
 Français
Modeste M. (verified owner) –
Very interesting book to read. It provides a very practical guide to statistical inference for comparing groups means using the R software. I highly recommend it.
Cees (verified owner) –
ANYASOR CHIGOZIE (verified owner) –
Your book helped we very well but I would have loved to see more practical applications.
Rafia (verified owner) –
Thanks. Its helpful to understand the analysis in R. It could be convenient if there are more explanations of the parameters. There will be an expectation for a book on Regression analysis with R.
Rita L. (verified owner) –
Very good books.
Anonymous (verified owner) –
Ioannis M. (verified owner) –
Very useful reference for R users that practice statistics regularly.
Ognjen (verified owner) –
Anonymous (verified owner) –
TC Bakker (verified owner) –
The content of the book is rather simple. It missed a good preview from the parts at the middle or end of the book.
Anonymous (verified owner) –
Alberto (verified owner) –
The book explains in a very simple way the practice of comparing groups in R, with different tests and methodology. Recommended!
Matteo P. (verified owner) –
I really enjoed the book, is pretty clear but i would suggest to add some use cases (when a test is better) and a little of math explanation for who has to study these methods
Anonymous (verified owner) –
This book covers t-test and ANOVA comprehensively. I used quite a few books on these topic and find this book is the best. Thanks to Kassambara for the excellent work!
Junji Yanagi (verified owner) –
It’s very good. Easy to buy and very reasonable price.
Pablo Caceres (verified owner) –
Great, great book. It is a practical book, full of instructions and recipes. You can apply its content inmediately. I didn’t rate five stars because there is a lack of some foundations about the statistical procedures. I m not speaking about mathematical foundations, just some explanations related with statistical tests
Anonymous (verified owner) –
Anthony B. (verified owner) –
Christopher Teh (verified owner) –
Straight-to-the-point reference book on using R for various statistical analyses and experimental designs. This is handy for those who simply want to know how to use R to analyze their data without having to go through a copious number of pages about various statistical theories and obtuse mathematical equations that only hardcore statisticians would understand, demand, and appreciate.
One weakness is the use of the author’s own R packages such as rstatix, which while convenient, limits the choices to users. Moreover, rstatix has a bug when using with group_by. Moreover, the development of rstatix appears to have been stalled, where increasing number of issues have been reported by users but without any response by the developer.
Astrid (verified owner) –
Good overview of different statistical tests and easy to apply, but low explaination of the output of the test beside the p-value.
Dang Van Tri (verified owner) –
I love this book. It’s beautiful and simple to read. But I’m insteresting with Kaplan–Meier and Cox which not written in your book
Josep I. (verified owner) –
Anonymous (verified owner) –
10/10 highly recommend!!
Cristian Opariuc-Dan (verified owner) –
Charles Gletsu (verified owner) –
I did not receive a link to the digital book that I purchased. And nobody has responded to my emails.
Gabriel (verified owner) –
Great content, succinct and precise.
Faysal Yatim (verified owner) –
Very good book balancing between theory and practice. The subject is very well addressed making easy its implémentation inR
José Antonio (verified owner) –
Excelente libro