
Cet article présente quelques exemples d’histogrammes dans R.
Données de démonstration
Données des poids par sexe:
set.seed(1234)
wdata = data.frame(
        sex = factor(rep(c("F", "M"), each=200)),
        weight = c(rnorm(200, 55), rnorm(200, 58))
        )

head(wdata, 4)
## sex weight
## 1 F 53.8
## 2 F 55.3
## 3 F 56.1
## 4 F 52.7Graphique R de base
hist(wdata$weight, breaks = 30, col = "steelblue", frame = FALSE)
Package GGPlot2
library(ggplot2)
theme_set(theme_bw())
# Graphique basique
ggplot(wdata, aes(x = weight)) +
geom_histogram(bins = 30)
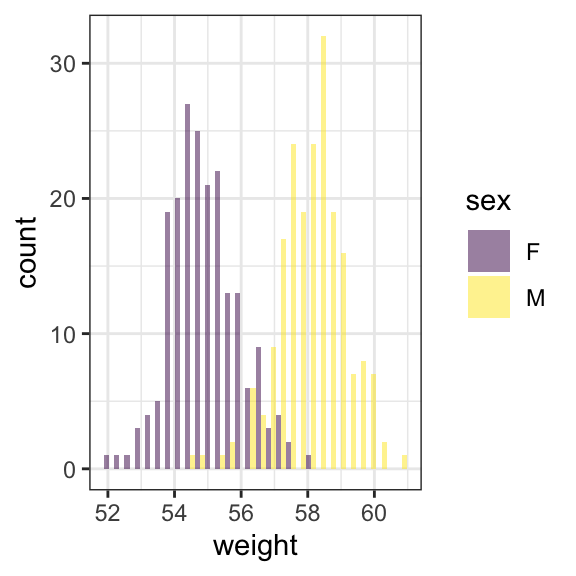
# Changer la couleur de remplissage par groupe de sexe
ggplot(wdata, aes(x = weight)) +
geom_histogram(aes(fill = sex), bins = 30, alpha = 0.5,
position = position_dodge()) +
scale_fill_viridis_d() 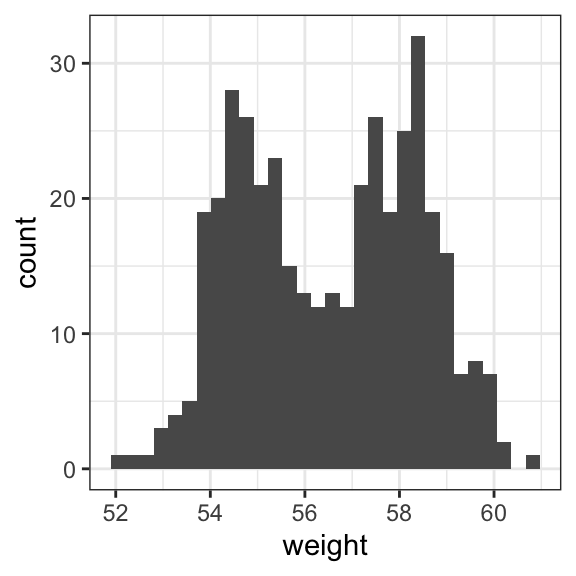
Package GGPubr
ggpubr : graphiques ggplot2 prêt à publication
library(ggpubr)
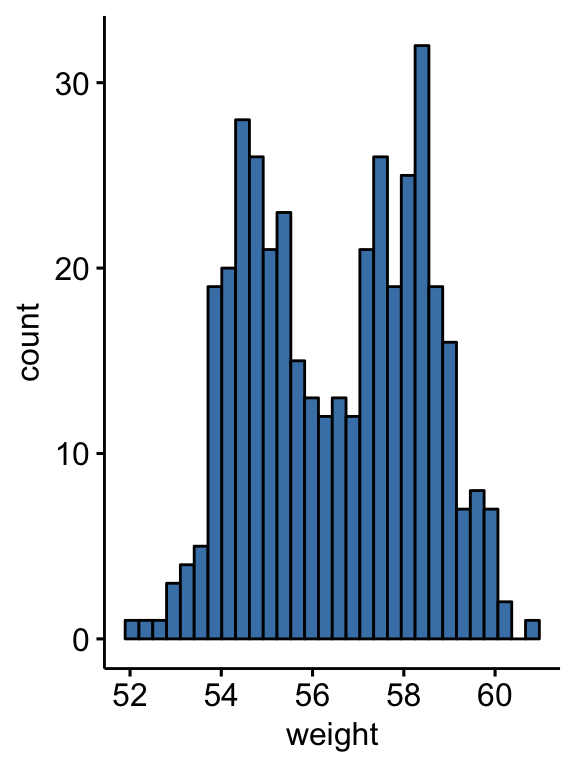
# Graphiques basiques
gghistogram(wdata, x = "weight", fill = "steelblue", alpha = 1)
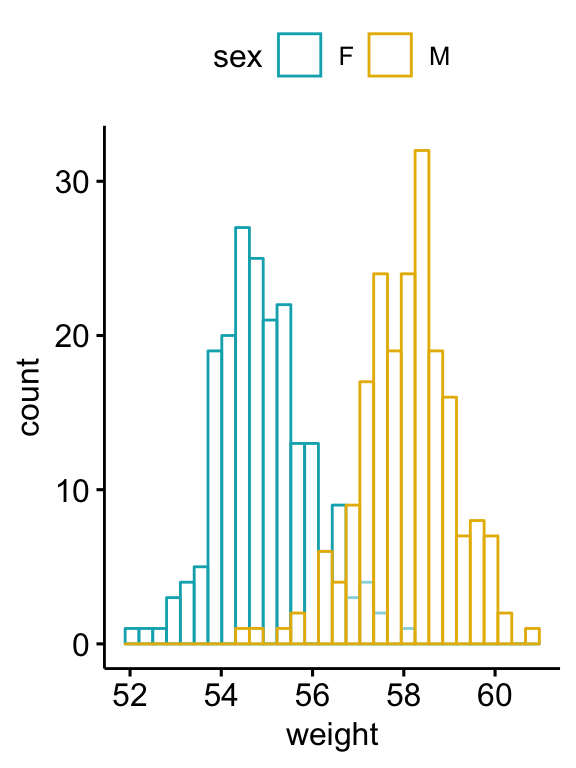
# Changer la couleur par groupe de sexe
gghistogram(
wdata, x = "weight", color = "sex",
palette = c("#00AFBB", "#E7B800")
)
Version:
 English


No Comments