
This article shows some R histogram examples.
Demo data
Weight data by sex:
set.seed(1234)
wdata = data.frame(
        sex = factor(rep(c("F", "M"), each=200)),
        weight = c(rnorm(200, 55), rnorm(200, 58))
        )

head(wdata, 4)
## sex weight
## 1 F 53.8
## 2 F 55.3
## 3 F 56.1
## 4 F 52.7R base plot
hist(wdata$weight, breaks = 30, col = "steelblue", frame = FALSE)
GGPlot2 package
library(ggplot2)
theme_set(theme_bw())
# Basic plot
ggplot(wdata, aes(x = weight)) +
geom_histogram(bins = 30)
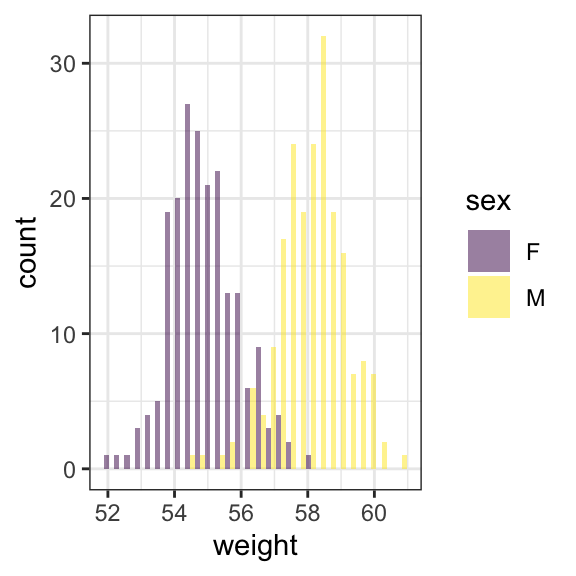
# Change fill color by sex group
ggplot(wdata, aes(x = weight)) +
geom_histogram(aes(fill = sex), bins = 30, alpha = 0.5,
position = position_dodge()) +
scale_fill_viridis_d() 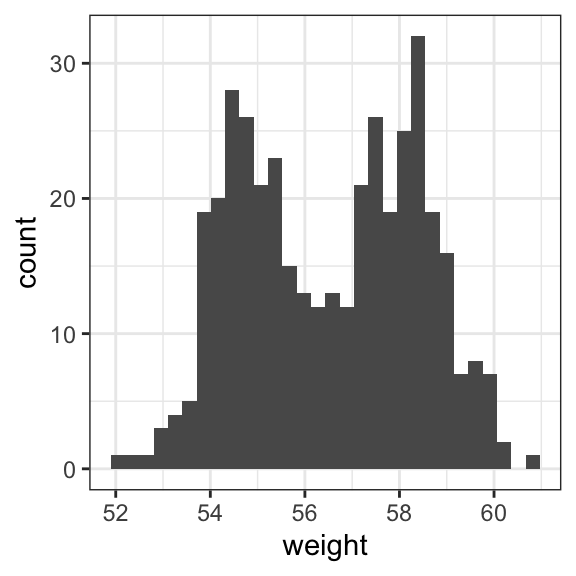
GGPubr package
ggpubr: ggplot2-based publication ready plots
library(ggpubr)
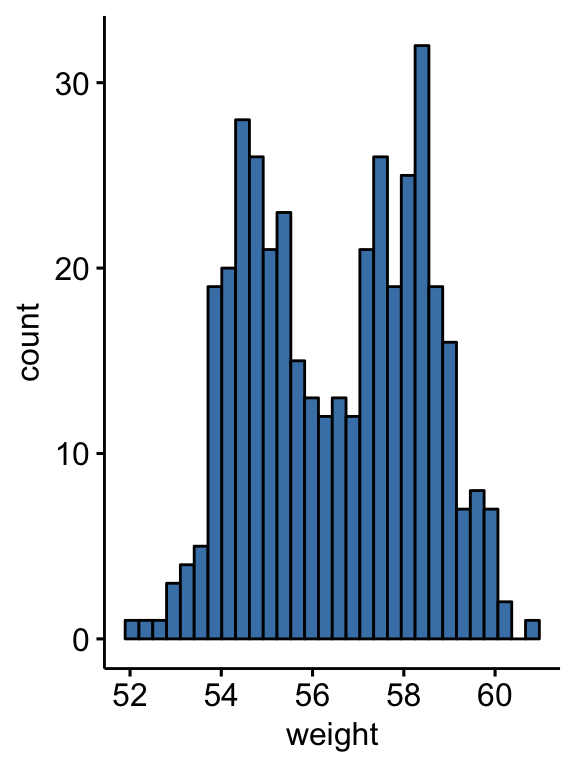
# Basic plots
gghistogram(wdata, x = "weight", fill = "steelblue", alpha = 1)
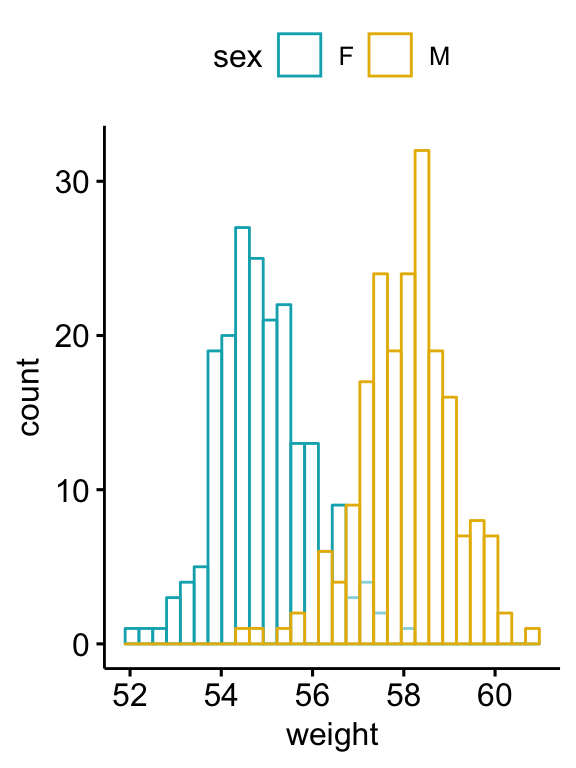
# Change color by sex group
gghistogram(
wdata, x = "weight", color = "sex",
palette = c("#00AFBB", "#E7B800")
)
Recommended for you
This section contains best data science and self-development resources to help you on your path.
Books - Data Science
Our Books
- Practical Guide to Cluster Analysis in R by A. Kassambara (Datanovia)
- Practical Guide To Principal Component Methods in R by A. Kassambara (Datanovia)
- Machine Learning Essentials: Practical Guide in R by A. Kassambara (Datanovia)
- R Graphics Essentials for Great Data Visualization by A. Kassambara (Datanovia)
- GGPlot2 Essentials for Great Data Visualization in R by A. Kassambara (Datanovia)
- Network Analysis and Visualization in R by A. Kassambara (Datanovia)
- Practical Statistics in R for Comparing Groups: Numerical Variables by A. Kassambara (Datanovia)
- Inter-Rater Reliability Essentials: Practical Guide in R by A. Kassambara (Datanovia)
Others
- R for Data Science: Import, Tidy, Transform, Visualize, and Model Data by Hadley Wickham & Garrett Grolemund
- Hands-On Machine Learning with Scikit-Learn, Keras, and TensorFlow: Concepts, Tools, and Techniques to Build Intelligent Systems by Aurelien Géron
- Practical Statistics for Data Scientists: 50 Essential Concepts by Peter Bruce & Andrew Bruce
- Hands-On Programming with R: Write Your Own Functions And Simulations by Garrett Grolemund & Hadley Wickham
- An Introduction to Statistical Learning: with Applications in R by Gareth James et al.
- Deep Learning with R by François Chollet & J.J. Allaire
- Deep Learning with Python by François Chollet
Version:
 Français


No Comments