Previously, we describe many statistical metrics, such as the Cohen’s Kappa @ref(cohen-s-kappa) and weighted Kappa @ref(weighted-kappa), for assessing the agreement or the concordance between two raters (judges, observers, clinicians) or two methods of measurement.
This chapter describes the agreement chart (S. I. Bangdiwala 1985), which provides a solution for visualizing the strength of the agreement between two methods measuring on ordinal scale. For example, the agreement chart can be used to visually compare two diagnostic or classification methods. Note that, the agreement plot is generally recommended for ordinal categorical variables.
You will learn:
- The basics for constructing an agreement chart
- R codes for creating an agreement chart
Contents:
Related Book
Inter-Rater Reliability Essentials: Practical Guide in RPrerequisites
Make sure you have installed the vcd package for visualizing categorical data.
install.packages("vcd")Construction of the agreement chart
Data structure. Let’s considere the following k x k contingency table, where k is the number of categories:
##           rater2
## rater1     Level.1 Level.2 Level... Level.k Total
##   Level.1  n11     n12     ...      n1k     n1+
##   Level.2  n21     n22     ...      n2k     n2+
##   Level... ...     ...     ...      ...     ...
##   Level.k  nk1     nk2     ...      nkk     nk+
## Total n+1 n+2 ... n+k NTerminologies:
- The column “Total” (
n1+, n2+, ..., nk+) indicates the sum of each row, known as row margins or marginal counts. Here, the total sum of a given rowiis namedni+. - The row “Total” (
n+1, n+2, ..., n+k) indicates the sum of each column, known as column margins. Here, the total sum of a given columniis namedn+i - N is the total sum of all table cells
Agreement chart. The agreement chart is a visual representation of a k × k square contingency table. It is constructed with the following steps (S. Bangdiwala and Shankar 2013, Friendly, Meyer, and Zeileis (2015)):
- Draw an N × N square, where N is the total sample size
- Draw k rectangles, each of dimensions row x column marginal totals, placed inside the N × N square
- Draw k black squares of dimensions based on the diagonal cell frequencies (
nii), placed inside the corresponding rectangle. These black squares represents to the observed agreement. - “Partial agreement” areas can be similarly placed within the rectangles, with gray color for cells further away from the diagonal cells.
Example of data
We’ll use the anxiety demo dataset where two clinical doctors classify 50 individuals into 4 ordered anxiety levels: “normal” (no anxiety), “moderate”, “high”, “very high”.
The data is organized in the following 3x3 contingency table:
anxiety <- as.table(
  rbind(
    c(11, 3, 1, 0), c(1, 9, 0, 1),
    c(0, 1, 10, 0 ), c(1, 2, 0, 10)
  )
)
dimnames(anxiety) <- list(
  Doctor1 = c("Normal", "Moderate", "High", "Very high"),
  Doctor2 = c("Normal", "Moderate", "High", "Very high")
)
anxiety
## Doctor2
## Doctor1 Normal Moderate High Very high
## Normal 11 3 1 0
## Moderate 1 9 0 1
## High 0 1 10 0
## Very high 1 2 0 10Note that the factor levels must be in the correct order, otherwise the results will be wrong.
Create an agreement chart in R
We want to visually compare the concordance of the two doctors diagnoses.
par(mar = c(4, 2, 2,2))
library(vcd)
# Create the plot
p <- agreementplot(anxiety)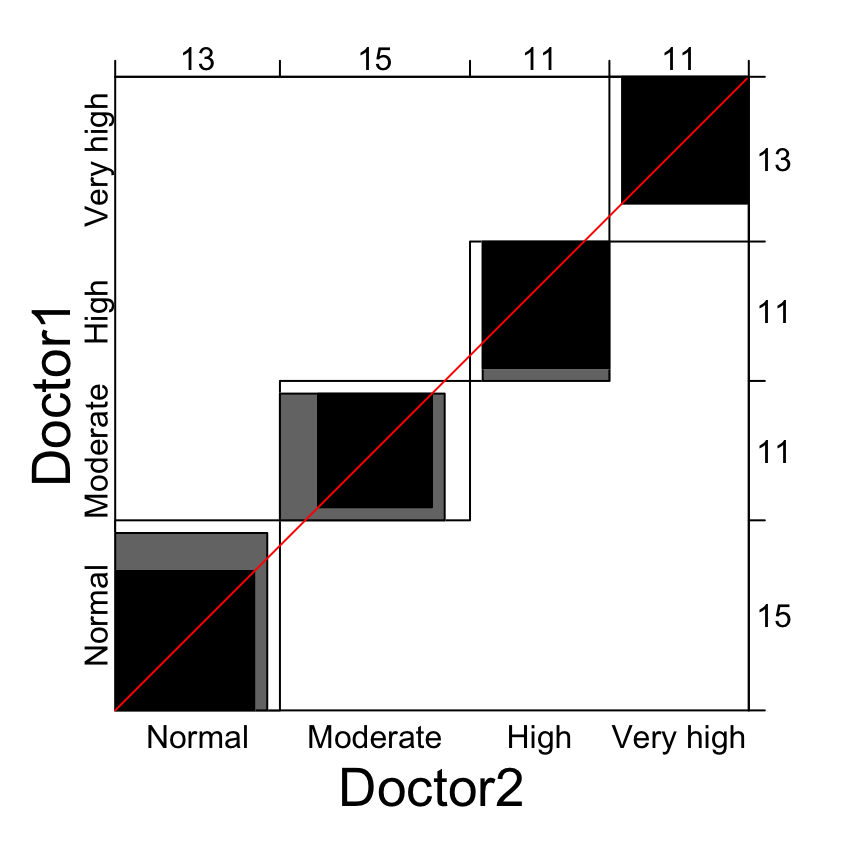
# Show the Bangdiwala agreement strength statistics
unlist(p)[1 : 2]
## Bangdiwala Bangdiwala_Weighted
## 0.644 0.795Legends for the plot:
- Black square: exact observed agreement
- Gray square: partial agreement by including a weighted contribution from off-diagonal cells. By default, the weight w = 1 is assigned to all diagonal cells (exact agreement); a quadratic weight (
1 - 1/(k - 1)^2) is assigned to the one-step disagreements (or to the one-step off-diagnal cells, partial agreement). If you don’t want to show partial agreement, specify the argumentweightsas follow:agreementplot(anxiety, weights = 1)
Note that,
- The visual image is affected if the order of the categories is permuted, and thus the use of agreement chart is recommended only for ordinal level variables (Bangdiwala et al., 2013).
- In the case of perfect agreement, the k rectangles determined by the marginal totals are all perfect squares and the shaded squares determined by the diagonal cell entries are exactly equal to the rectangles, producing a B-statistic value of 1 (Bangdiwala et al., 2013).
- Lesser agreement is visualized by comparing the area of the blackened squares to the area of the rectangles (Bangdiwala et al., 2013).
- It may happen that one rater consistently tends to classify the subject into higher or lower categories than the other, perhaps due to using stricter thresholds for the boundaries between adjacent categories (Friendly et al., 2015). This observers or raters bias is visualized by examining the deviation of the dark squares from the 45° diagonal line within the larger N x N square (Bangdiwala et al., 2013; Friendly et al., 2015].
Summary
This article describes how to create an agreement chart in R.
References
Bangdiwala, Shrikant I. 1985. “A Graphical Test for Observer Agreement.” Amsterdam: International Statistical Institute, 307–8.
Bangdiwala, Shrikant, and Viswanathan Shankar. 2013. “The Agreement Chart.” BMC Medical Research Methodology 13 (July): 97. doi:10.1186/1471-2288-13-97.
Friendly, Michael, D. Meyer, and A. Zeileis. 2015. Discrete Data Analysis with R: Visualization and Modeling Techniques for Categorical and Count Data. 1st ed. Chapman; Hall/CRC.
Recommended for you
This section contains best data science and self-development resources to help you on your path.
Books - Data Science
Our Books
- Practical Guide to Cluster Analysis in R by A. Kassambara (Datanovia)
- Practical Guide To Principal Component Methods in R by A. Kassambara (Datanovia)
- Machine Learning Essentials: Practical Guide in R by A. Kassambara (Datanovia)
- R Graphics Essentials for Great Data Visualization by A. Kassambara (Datanovia)
- GGPlot2 Essentials for Great Data Visualization in R by A. Kassambara (Datanovia)
- Network Analysis and Visualization in R by A. Kassambara (Datanovia)
- Practical Statistics in R for Comparing Groups: Numerical Variables by A. Kassambara (Datanovia)
- Inter-Rater Reliability Essentials: Practical Guide in R by A. Kassambara (Datanovia)
Others
- R for Data Science: Import, Tidy, Transform, Visualize, and Model Data by Hadley Wickham & Garrett Grolemund
- Hands-On Machine Learning with Scikit-Learn, Keras, and TensorFlow: Concepts, Tools, and Techniques to Build Intelligent Systems by Aurelien Géron
- Practical Statistics for Data Scientists: 50 Essential Concepts by Peter Bruce & Andrew Bruce
- Hands-On Programming with R: Write Your Own Functions And Simulations by Garrett Grolemund & Hadley Wickham
- An Introduction to Statistical Learning: with Applications in R by Gareth James et al.
- Deep Learning with R by François Chollet & J.J. Allaire
- Deep Learning with Python by François Chollet
Version:
 Français

No Comments