The sign test is used to compare the medians of paired or matched observations. It is an alternative to the paired-samples t-test (Chapter @ref(t-test)) and the Wilcoxon signed-rank test (Chapter @ref(wilcoxon-test)) in the situation, where the distribution of differences between paired data values is neither normal (in t-test) nor symmetrical (in Wilcoxon test).
Note that, the sign test does not make any assumptions about the data distributions. However, it will most likely be less powerful compared to the Wilcoxon test and the t-test.
Therefore, if the distribution of the differences between the two paired groups is symmetrical in shape, you could consider using the more powerful Wilcoxon signed-rank test instead of the sign test.
In this chapter, you will learn how to compute paired-samples sign test using the R function sign_test() [rstatix package].
Contents:
Related Book
Practical Statistics in R II - Comparing Groups: Numerical VariablesPrerequisites
Make sure that you have installed the following R packages:
tidyversefor data manipulation and visualizationggpubrfor creating easily publication ready plotsrstatixprovides pipe-friendly R functions for easy statistical analysesdatarium: contains required datasets for this chapter
Start by loading the following required packages:
library(tidyverse)
library(rstatix)
library(ggpubr)
Demo dataset
Here, we’ll use a demo dataset mice2 [datarium package], which contains the weight of 10 mice before and after the treatment.
# Wide data
data("mice2", package = "datarium")
head(mice2, 3)
## id before after
## 1 1 187 430
## 2 2 194 404
## 3 3 232 406# Transform into long data:
# gather the before and after values in the same column
mice2.long <- mice2 %>%
gather(key = "group", value = "weight", before, after)
head(mice2.long, 3)## id group weight
## 1 1 before 187
## 2 2 before 194
## 3 3 before 232Statistical hypotheses
The paired-samples sign test evaluates whether the median of paired differences is statistically significantly different to 0.
- Null hypotheses, H0: median of the paired differences = 0
- Alternative hypotheses, Ha: median of the paired differences is different to 0
Summary statistics
Compute some summary statistics by groups: median and interquartile range (IQR).
mice2.long %>%
  group_by(group) %>%
  get_summary_stats(weight, type = "median_iqr")
## # A tibble: 2 x 5
## group variable n median iqr
## <chr> <chr> <dbl> <dbl> <dbl>
## 1 after weight 10 405 28.3
## 2 before weight 10 197. 19.2Visualization
bxp <- ggpaired(mice2.long, x = "group", y = "weight",
         order = c("before", "after"),
         ylab = "Weight", xlab = "Groups")
bxp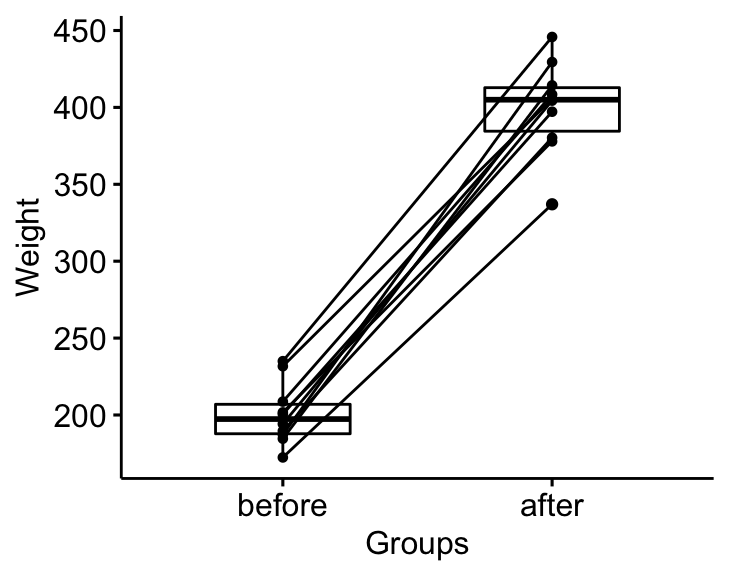
Computation
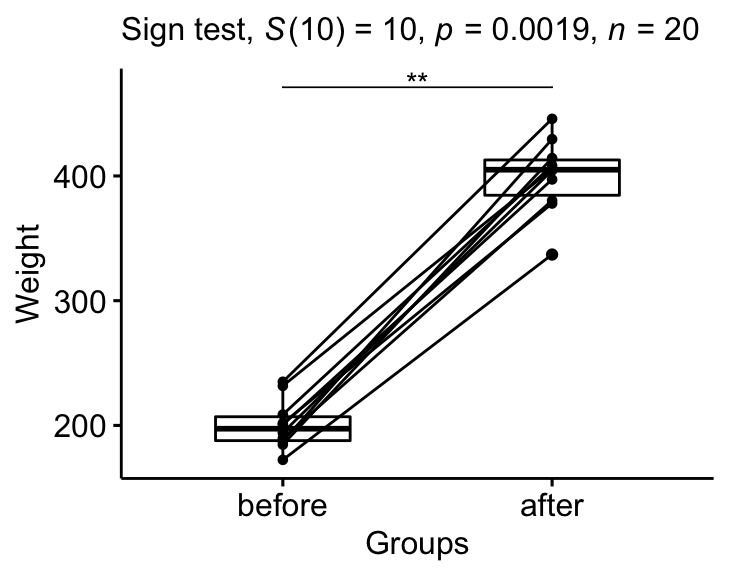
Question : Is there any significant changes in the weights of mice after treatment?
stat.test <- mice2.long  %>%
  sign_test(weight ~ group) %>%
  add_significance()
stat.test
## # A tibble: 1 x 9
## .y. group1 group2 n1 n2 statistic df p p.signif
## <chr> <chr> <chr> <int> <int> <dbl> <dbl> <dbl> <chr>
## 1 weight after before 10 10 10 10 0.00195 **Report
We could report the results as follow:
The median weight of the mice before treatment is significantly different from the median weight after treatment using sign test, p-value = 0.002.
stat.test <- stat.test %>% add_xy_position(x = "group")
bxp +
  stat_pvalue_manual(stat.test, tip.length = 0) +
  labs(
  subtitle = get_test_label(stat.test, detailed= TRUE)
  )
Summary
This chapter describes how to compute and report the Sign test in R.
Recommended for you
This section contains best data science and self-development resources to help you on your path.
Books - Data Science
Our Books
- Practical Guide to Cluster Analysis in R by A. Kassambara (Datanovia)
- Practical Guide To Principal Component Methods in R by A. Kassambara (Datanovia)
- Machine Learning Essentials: Practical Guide in R by A. Kassambara (Datanovia)
- R Graphics Essentials for Great Data Visualization by A. Kassambara (Datanovia)
- GGPlot2 Essentials for Great Data Visualization in R by A. Kassambara (Datanovia)
- Network Analysis and Visualization in R by A. Kassambara (Datanovia)
- Practical Statistics in R for Comparing Groups: Numerical Variables by A. Kassambara (Datanovia)
- Inter-Rater Reliability Essentials: Practical Guide in R by A. Kassambara (Datanovia)
Others
- R for Data Science: Import, Tidy, Transform, Visualize, and Model Data by Hadley Wickham & Garrett Grolemund
- Hands-On Machine Learning with Scikit-Learn, Keras, and TensorFlow: Concepts, Tools, and Techniques to Build Intelligent Systems by Aurelien Géron
- Practical Statistics for Data Scientists: 50 Essential Concepts by Peter Bruce & Andrew Bruce
- Hands-On Programming with R: Write Your Own Functions And Simulations by Garrett Grolemund & Hadley Wickham
- An Introduction to Statistical Learning: with Applications in R by Gareth James et al.
- Deep Learning with R by François Chollet & J.J. Allaire
- Deep Learning with Python by François Chollet
Version:
 Français

This example does not work for me:
stat.test %
+ sign_test(weight ~ group) %>%
+ add_significance()
Error in UseMethod(“sign_test”) :
no applicable method for ‘sign_test’ applied to an object of class “data.frame”