
This article describes R functions for changing ggplot axis limits (or scales). We’ll describe how to specify the minimum and the maximum values of axes.
Among the different functions available in ggplot2 for setting the axis range, the coord_cartesian() function is the most preferred, because it zoom the plot without clipping the data.
In this R graphics tutorial, you will learn how to:
- Change axis limits using
coord_cartesian(),xlim(),ylim()and more. - Set the intercept of x and y axes at zero (0,0).
- Expand the plot limits to ensure that limits include a single value for all plots or panels.
Contents:
Key ggplot2 R functions
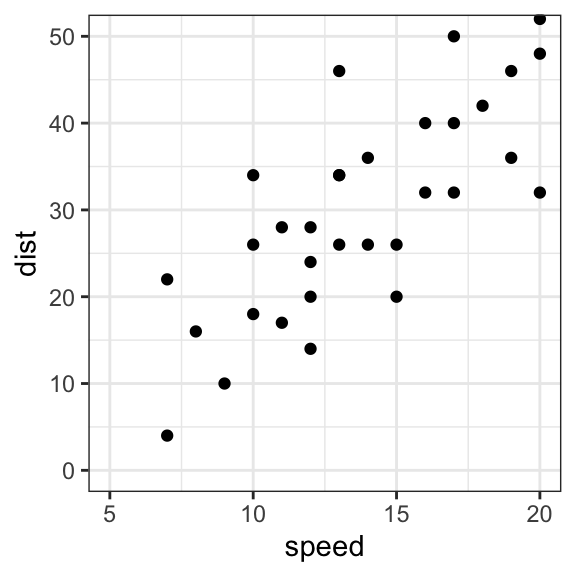
Start by creating a scatter plot using the cars data set:
library(ggplot2)
p <- ggplot(cars, aes(x = speed, y = dist)) +
  geom_point()
3 Key functions are available to set the axis limits and scales:
- Without clipping (preferred). Cartesian coordinates. The Cartesian coordinate system is the most common type of coordinate system. It will zoom the plot, without clipping the data.
p + coord_cartesian(xlim = c(5, 20), ylim = c(0, 50))- With clipping the data (removes unseen data points). Observations not in this range will be dropped completely and not passed to any other layers.
# Use this
p + scale_x_continuous(limits = c(5, 20)) +
  scale_y_continuous(limits = c(0, 50))

# Or this shothand functions
p + xlim(5, 20) + ylim(0, 50)
Note that, scale_x_continuous() and scale_y_continuous() remove all data points outside the given range and, the coord_cartesian() function only adjusts the visible area.
In most cases you would not see the difference, but if you fit anything to the data the functions scale_x_continuous() / scale_y_continuous() would probably change the fitted values.
- Expand the plot limits to ensure that a given value is included in all panels or all plots.
# set the intercept of x and y axes at (0,0)
p + expand_limits(x = 0, y = 0)

# Expand plot limits
p + expand_limits(x = c(5, 50), y = c(0, 150))
Change axis limits
Use coord_cartesian
Most common coordinate system (preferred). Zoom the plot.
# Default plot
print(p)

# Change axis limits using coord_cartesian()
p + coord_cartesian(xlim =c(5, 20), ylim = c(0, 50))
Use xlim and ylim
- p + xlim(min, max): change x axis limits
- p + ylim(min, max): change y axis limits
Any values outside the limits will be replaced by NA and dropped.
p + xlim(5, 20) + ylim(0, 50)Use scale_x_continuous and scale_y_continuous
Can be used to change, at the same time, the axis scales and labels, respectively:
p + scale_x_continuous(name = "Speed of cars", limits = c(0, 30)) +
  scale_y_continuous(name = "Stopping distance", limits = c(0, 150))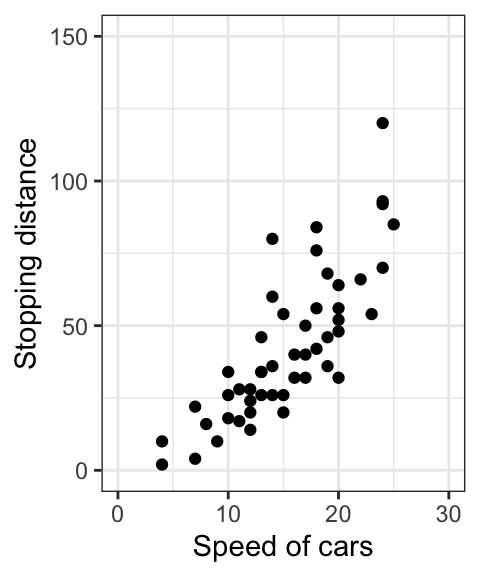
Expand plot limits
Key function expand_limits(). Can be used to :
- quickly set the intercept of x and y axes at (0,0)
- expand the limits of x and y axes
# set the intercept of x and y axis at (0,0)
p + expand_limits(x = 0, y = 0)
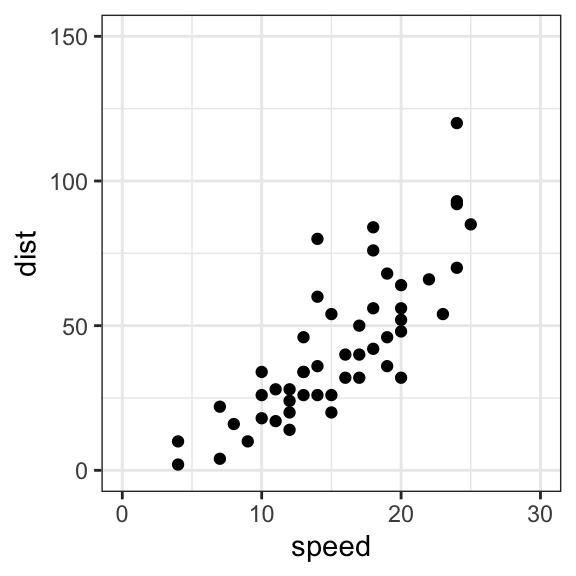
# change the axis limits
p + expand_limits(x=c(0,30), y=c(0, 150))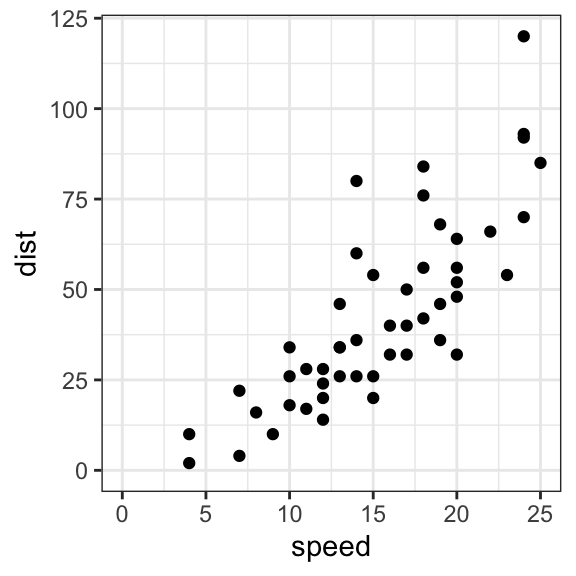
Conclusion
- Create an example of ggplot:
library(ggplot2)
p <- ggplot(cars, aes(x = speed, y = dist)) +
geom_point()- Set a ggplot axis limits:
p + coord_cartesian(xlim = c(5, 20), ylim = (0, 50))- Set the intercept of x and y axis at zero (0, 0) coordinates:
p + expand_limits(x = 0, y = 0)Recommended for you
This section contains best data science and self-development resources to help you on your path.
Books - Data Science
Our Books
- Practical Guide to Cluster Analysis in R by A. Kassambara (Datanovia)
- Practical Guide To Principal Component Methods in R by A. Kassambara (Datanovia)
- Machine Learning Essentials: Practical Guide in R by A. Kassambara (Datanovia)
- R Graphics Essentials for Great Data Visualization by A. Kassambara (Datanovia)
- GGPlot2 Essentials for Great Data Visualization in R by A. Kassambara (Datanovia)
- Network Analysis and Visualization in R by A. Kassambara (Datanovia)
- Practical Statistics in R for Comparing Groups: Numerical Variables by A. Kassambara (Datanovia)
- Inter-Rater Reliability Essentials: Practical Guide in R by A. Kassambara (Datanovia)
Others
- R for Data Science: Import, Tidy, Transform, Visualize, and Model Data by Hadley Wickham & Garrett Grolemund
- Hands-On Machine Learning with Scikit-Learn, Keras, and TensorFlow: Concepts, Tools, and Techniques to Build Intelligent Systems by Aurelien Géron
- Practical Statistics for Data Scientists: 50 Essential Concepts by Peter Bruce & Andrew Bruce
- Hands-On Programming with R: Write Your Own Functions And Simulations by Garrett Grolemund & Hadley Wickham
- An Introduction to Statistical Learning: with Applications in R by Gareth James et al.
- Deep Learning with R by François Chollet & J.J. Allaire
- Deep Learning with Python by François Chollet
Version:
 Français


Hi! Thanks for the post.
I just noticed that the funcion concatenate (“c(…)”) is missing for “ylim” in section:
“3 Key functions are available to set the axis limits and scales:”
Regards,
Mat.
Fixed now, thanks! I appreciate your feedback!
great post! Very clear!
Thank you for the positive feedback!