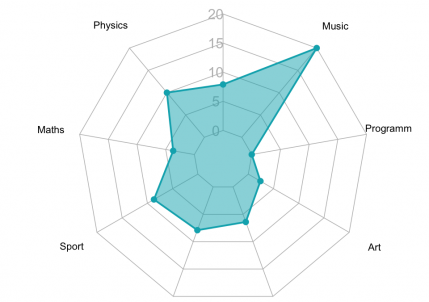
13215310615215310010810493 1.1KShares A radar chart, also known as a spider plot is used to visualize the values or scores assigned...
32633 1 1 19Shares A radar chart, also known as a spider plot is used to visualize the values or scores assigned...