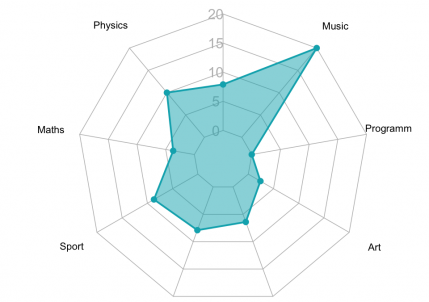
127148101150147981029890 1.1KShares A radar chart, also known as a spider plot is used to visualize the values or scores assigned...
32633 1 1 19Shares A radar chart, also known as a spider plot is used to visualize the values or scores assigned...
127148101150147981029890 1.1KShares A radar chart, also known as a spider plot is used to visualize the values or scores assigned...
32633 1 1 19Shares A radar chart, also known as a spider plot is used to visualize the values or scores assigned...
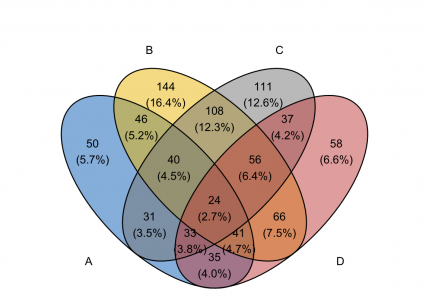
343462562 35Shares This article provides multiple solutions to create an elegant Venn diagram with R or RStudio. The following R...
343462562 35Shares This article provides multiple solutions to create an elegant Venn diagram with R or RStudio. The following R...
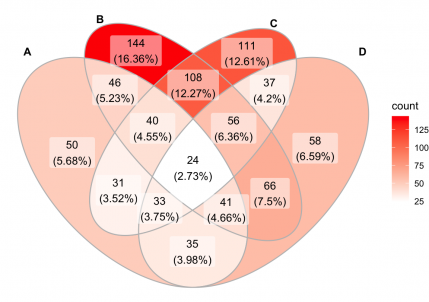
1 11 3Shares Introduction This article describes how to create a beautiful ggplot Venn diagram. There are multiple extensions of the...
1 11 3Shares Introduction This article describes how to create a beautiful ggplot Venn diagram. There are multiple extensions of the...
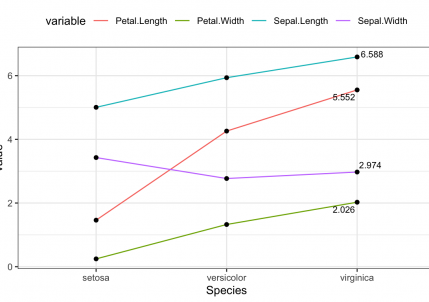
1 1Share This article describes how to display the last value of each line as a label using the ggplot2...
1 1Share This article describes how to display the last value of each line as a label using the ggplot2...
This articles describes how to create and customize an interactive heatmap in R using the heatmaply R package,...
This articles describes how to create and customize an interactive heatmap in R using the heatmaply R package,...
2 3 1 6Shares This article describes seriation methods, which consists of finding a suitable linear order for a set of objects...
2 3 1 6Shares This article describes seriation methods, which consists of finding a suitable linear order for a set of objects...
1 1Share Data normalization methods are used to make variables, measured in different scales, have comparable values. This preprocessing steps...
1 1Share Data normalization methods are used to make variables, measured in different scales, have comparable values. This preprocessing steps...

Missing values are generally represented by NA in a data frame. Here, we will describe how to visualize...
Missing values are generally represented by NA in a data frame. Here, we will describe how to visualize...
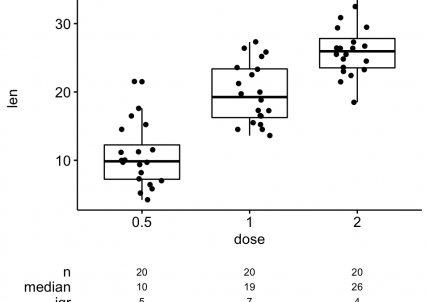
You will learn how to create beautiful plots in R and add summary summary statistics table such as...
You will learn how to create beautiful plots in R and add summary summary statistics table such as...
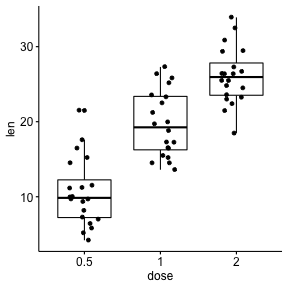
R codes are provided for creating a nice box and whisker plot in R with summary table under...
R codes are provided for creating a nice box and whisker plot in R with summary table under...