
This article describes how to create a ggplot with a log scale. This can be done easily using the ggplot2 functions scale_x_continuous() and scale_y_continuous(), which make it possible to set log2 or log10 axis scale. An other possibility is the function scale_x_log10() and scale_y_log10(), which transform, respectively, the x and y axis scales into a log scale: base 10.
Note that, the scale functions transform the data. If you fit anything to the data it would probably change the fitted values.
An alternative is to use the function coord_trans() for transformed Cartesian coordinate system. coord_trans() is different to scale transformations in that it occurs after statistical transformation and will affect only the visual appearance of geoms.
In this R graphics tutorial, you will learn how to:
- Log transform x and y axes into log2 or log10 scale
- Show exponent after the logarithmic changes by formatting axis ticks mark labels.
- Display log scale ticks. R function: annotation_logticks()
Contents:
Key ggplot2 R functions
Start by creating a scatter plot using the cars data set:
library(ggplot2)
p <- ggplot(cars, aes(x = speed, y = dist)) +
  geom_point()
p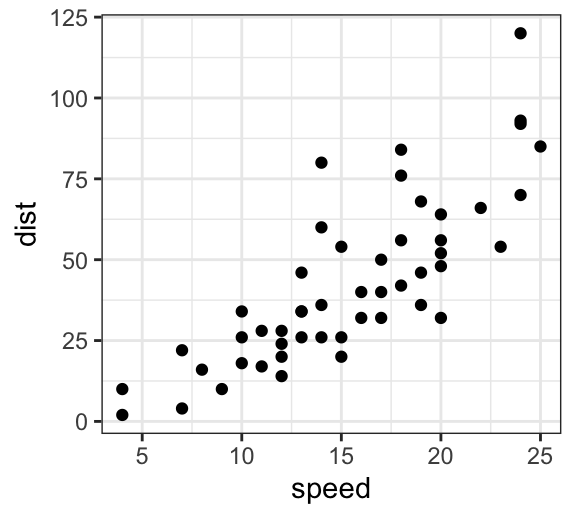
R functions to set a logarithmic axis:
- p + scale_x_log10(), p + scale_y_log10() : Plot x and y in log 10 scale, respectively.
- p + coord_trans(x = “log2”, y = “log2”): Transformed cartesian coordinate system. Possible values for x and y are “log2”, “log10”, “sqrt”, …
- p + scale_x_continuous(trans = “log2”), p + scale_y_continuous(trans = “log2”). Allowed value for the argument trans, include also ‘log10’.
- p + scale_y_log10() + annotation_logticks(): Display log scale ticks.
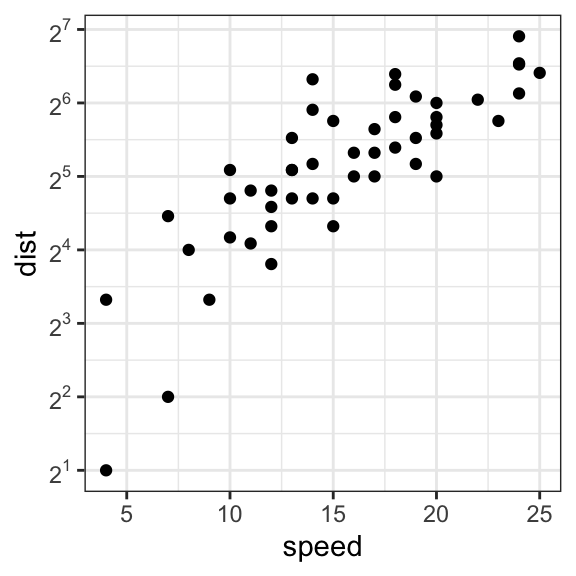
Set axis into log2 scale
- Log2 transformation of x and y axes
- Format ticks label to show exponents
# Possible values for trans : 'log2', 'log10','sqrt'
p + scale_x_continuous(trans = 'log2') +
  scale_y_continuous(trans = 'log2')

# Format y axis tick mark labels to show exponents
require(scales)
p + scale_y_continuous(trans = log2_trans(),
    breaks = trans_breaks("log2", function(x) 2^x),
    labels = trans_format("log2", math_format(2^.x)))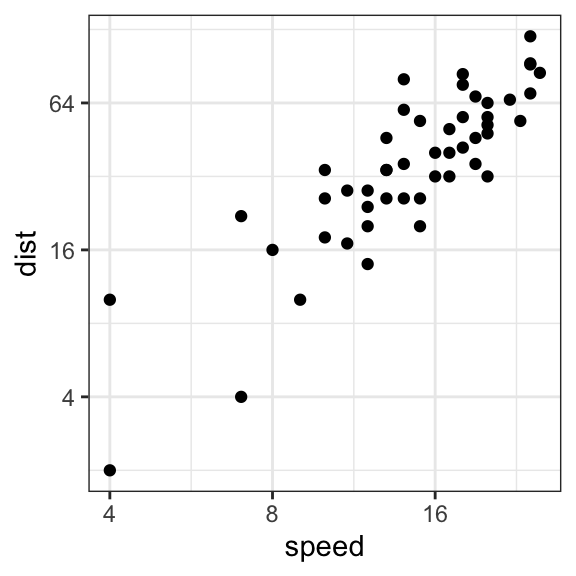
Set axis into log10 scale
The following R code changes the y axis scale into log10 scale using the function scale_y_log10():
p + scale_y_log10()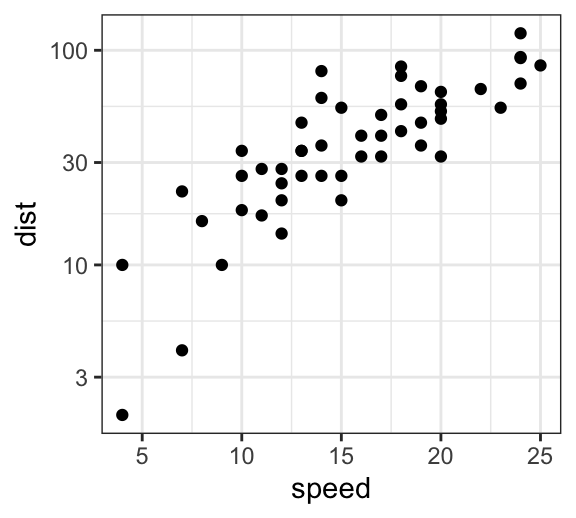
Alternatively, you can use the function scale_y_continuous(), which allows to transform breaks and the format of labels.
p + scale_y_continuous(trans = "log10")Display log scale ticks mark
Note that, log scale ticks make sense only for log scale base 10.
Key function: annotation_logticks() Data: Animals data sets, from the package MASS
- Create a log-log plot without log scale ticks:
# Load packages
require(MASS) # to access Animals data sets
require(scales) # to access break formatting functions
data(Animals) # load data

# x and y axis are transformed and formatted
p2 <- ggplot(Animals, aes(x = body, y = brain)) + geom_point() +
     scale_x_log10(breaks = trans_breaks("log10", function(x) 10^x),
              labels = trans_format("log10", math_format(10^.x))) +
     scale_y_log10(breaks = trans_breaks("log10", function(x) 10^x),
              labels = trans_format("log10", math_format(10^.x))) +
     theme_bw()
p2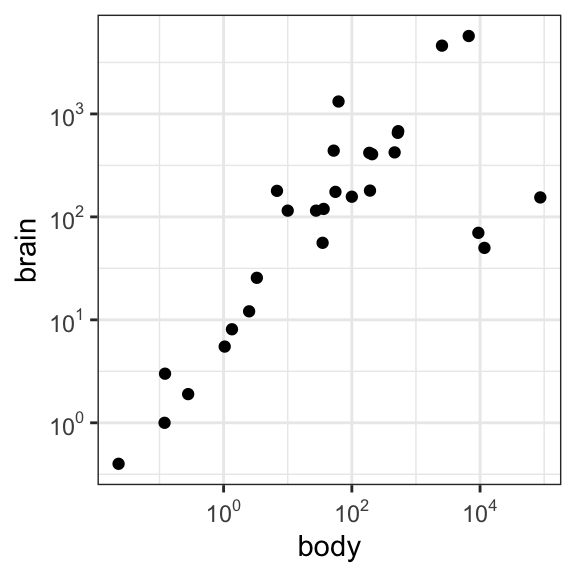
- Show log scale ticks:
p2 + annotation_logticks() 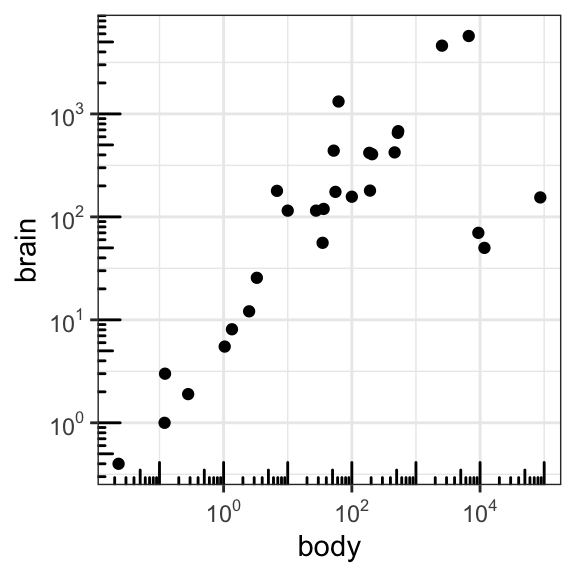
Note that, default log ticks are on bottom and left. To specify the sides of the log ticks :
# Log ticks on left and right
p2 + annotation_logticks(sides="lr")

# All sides
p2+annotation_logticks(sides="trbl")
Allowed values for the argument sides are the combination of “t” (top), “r” (right), “b” (bottom), “l” (left).
Conclusion
We introduce how to create a ggplot with log scale. Briefly, the steps are as follow:
- Create an example of ggplot:
library(ggplot2)
p <- ggplot(cars, aes(x = speed, y = dist)) +
geom_point()- Log transformation of the axis scale:
 # log base 2 scale
p + scale_x_continuous(trans = 'log2') +
  scale_y_continuous(trans = 'log2')

# Log base 10 scale + log ticks (on left and bottom side)
p + scale_x_continuous(trans = 'log10') +
  scale_y_continuous(trans = 'log10')+
  annotation_logticks(sides="lb")
Recommended for you
This section contains best data science and self-development resources to help you on your path.
Books - Data Science
Our Books
- Practical Guide to Cluster Analysis in R by A. Kassambara (Datanovia)
- Practical Guide To Principal Component Methods in R by A. Kassambara (Datanovia)
- Machine Learning Essentials: Practical Guide in R by A. Kassambara (Datanovia)
- R Graphics Essentials for Great Data Visualization by A. Kassambara (Datanovia)
- GGPlot2 Essentials for Great Data Visualization in R by A. Kassambara (Datanovia)
- Network Analysis and Visualization in R by A. Kassambara (Datanovia)
- Practical Statistics in R for Comparing Groups: Numerical Variables by A. Kassambara (Datanovia)
- Inter-Rater Reliability Essentials: Practical Guide in R by A. Kassambara (Datanovia)
Others
- R for Data Science: Import, Tidy, Transform, Visualize, and Model Data by Hadley Wickham & Garrett Grolemund
- Hands-On Machine Learning with Scikit-Learn, Keras, and TensorFlow: Concepts, Tools, and Techniques to Build Intelligent Systems by Aurelien Géron
- Practical Statistics for Data Scientists: 50 Essential Concepts by Peter Bruce & Andrew Bruce
- Hands-On Programming with R: Write Your Own Functions And Simulations by Garrett Grolemund & Hadley Wickham
- An Introduction to Statistical Learning: with Applications in R by Gareth James et al.
- Deep Learning with R by François Chollet & J.J. Allaire
- Deep Learning with Python by François Chollet
Version:
 Français


No Comments