Prerequisites
# Load required R packages
library(tidyverse)
library(rstatix)
library(ggpubr)
Data preparation
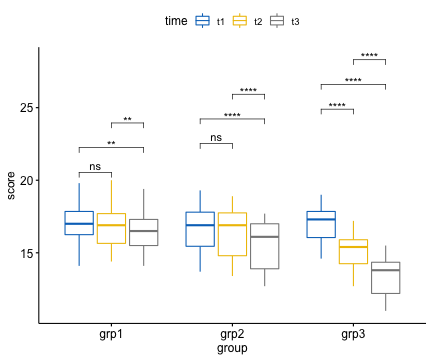
We’ll use the anxiety dataset [in the datarium package], which contains the anxiety score, measured at three time points (t1, t2 and t3), of three groups of individuals practicing physical exercises at different levels (grp1: basal, grp2: moderate and grp3: high).
Load and show one random row by group:
# Wide format
set.seed(123)
data("anxiety", package = "datarium")
anxiety %>% sample_n_by(group, size = 1)
## # A tibble: 3 x 5
## id group t1 t2 t3
## <fct> <fct> <dbl> <dbl> <dbl>
## 1 5 grp1 16.5 15.8 15.7
## 2 27 grp2 17.8 17.7 16.9
## 3 37 grp3 17.1 15.6 14.3# Gather the columns t1, t2 and t3 into long format.
# Convert id and time into factor variables
anxiety <- anxiety %>%
gather(key = "time", value = "score", t1, t2, t3) %>%
convert_as_factor(id, time)
# Inspect some random rows of the data by groups
set.seed(123)
anxiety %>% sample_n_by(group, time, size = 1)## # A tibble: 9 x 4
## id group time score
## <fct> <fct> <fct> <dbl>
## 1 5 grp1 t1 16.5
## 2 12 grp1 t2 17.7
## 3 7 grp1 t3 16.5
## 4 29 grp2 t1 18.4
## 5 30 grp2 t2 18.9
## 6 16 grp2 t3 12.7
## 7 38 grp3 t1 17.3
## 8 44 grp3 t2 16.4
## 9 39 grp3 t3 14.4Run multiple pairwise comparisons using paired t-tests
P-values are adjusted using the Bonferroni multiple testing correction method.
# Pairwise comparisons between time points at each group levels
# Paired t-test is used because we have repeated measures by time
stat.test <- anxiety %>%
  group_by(group) %>%
  pairwise_t_test(
    score ~ time, paired = TRUE,
    p.adjust.method = "bonferroni"
    ) %>%
  select(-df, -statistic, -p) # Remove details
stat.test
## # A tibble: 9 x 8
## group .y. group1 group2 n1 n2 p.adj p.adj.signif
## * <fct> <chr> <chr> <chr> <int> <int> <dbl> <chr>
## 1 grp1 score t1 t2 15 15 1.94e- 1 ns
## 2 grp1 score t1 t3 15 15 2.00e- 3 **
## 3 grp1 score t2 t3 15 15 6.00e- 3 **
## 4 grp2 score t1 t2 15 15 2.68e- 1 ns
## 5 grp2 score t1 t3 15 15 1.51e- 7 ****
## 6 grp2 score t2 t3 15 15 6.12e- 8 ****
## 7 grp3 score t1 t2 15 15 5.97e-11 ****
## 8 grp3 score t1 t3 15 15 5.16e-13 ****
## 9 grp3 score t2 t3 15 15 1.78e- 9 ****The pairwise comparisons t1 vs t3 and t2 vs t3 were statistically significantly different for all groups.
Visualization: box plots with p-values
# Create the plot
bxp <- ggboxplot(
  anxiety, x = "group", y = "score",
  color = "time", palette = "jco"
  )
# Add statistical test p-values
stat.test <- stat.test %>% add_xy_position(x = "group")
bxp + stat_pvalue_manual(
  stat.test, label = "p.adj.signif",
  step.increase = 0.08
  )
# Hide ns
bxp + stat_pvalue_manual(
  stat.test, label = "p.adj.signif",
  step.increase = 0.08, hide.ns = TRUE, tip.length = 0
  )
Recommended for you
This section contains best data science and self-development resources to help you on your path.
Books - Data Science
Our Books
- Practical Guide to Cluster Analysis in R by A. Kassambara (Datanovia)
- Practical Guide To Principal Component Methods in R by A. Kassambara (Datanovia)
- Machine Learning Essentials: Practical Guide in R by A. Kassambara (Datanovia)
- R Graphics Essentials for Great Data Visualization by A. Kassambara (Datanovia)
- GGPlot2 Essentials for Great Data Visualization in R by A. Kassambara (Datanovia)
- Network Analysis and Visualization in R by A. Kassambara (Datanovia)
- Practical Statistics in R for Comparing Groups: Numerical Variables by A. Kassambara (Datanovia)
- Inter-Rater Reliability Essentials: Practical Guide in R by A. Kassambara (Datanovia)
Others
- R for Data Science: Import, Tidy, Transform, Visualize, and Model Data by Hadley Wickham & Garrett Grolemund
- Hands-On Machine Learning with Scikit-Learn, Keras, and TensorFlow: Concepts, Tools, and Techniques to Build Intelligent Systems by Aurelien Géron
- Practical Statistics for Data Scientists: 50 Essential Concepts by Peter Bruce & Andrew Bruce
- Hands-On Programming with R: Write Your Own Functions And Simulations by Garrett Grolemund & Hadley Wickham
- An Introduction to Statistical Learning: with Applications in R by Gareth James et al.
- Deep Learning with R by François Chollet & J.J. Allaire
- Deep Learning with Python by François Chollet
Version:
 Français


No Comments