Prerequisites
# Load required R packages
library(tidyverse)
library(rstatix)
library(ggpubr)

# Prepare the data and inspect a random sample of the data
mydata <- as_tibble(iris)
mydata %>% sample_n(6)
## # A tibble: 6 x 5
## Sepal.Length Sepal.Width Petal.Length Petal.Width Species
## <dbl> <dbl> <dbl> <dbl> <fct>
## 1 7.7 2.6 6.9 2.3 virginica
## 2 5 2 3.5 1 versicolor
## 3 7.4 2.8 6.1 1.9 virginica
## 4 6 3 4.8 1.8 virginica
## 5 4.6 3.4 1.4 0.3 setosa
## 6 6.8 2.8 4.8 1.4 versicolor# Transform the data into long format
# Put all variables in the same column except `Species`, the grouping variable
mydata.long <- mydata %>%
pivot_longer(-Species, names_to = "variables", values_to = "value")
mydata.long %>% sample_n(6)## # A tibble: 6 x 3
## Species variables value
## <fct> <chr> <dbl>
## 1 virginica Petal.Width 1.5
## 2 versicolor Petal.Length 3.9
## 3 versicolor Sepal.Width 2.2
## 4 virginica Petal.Width 1.9
## 5 versicolor Petal.Length 4.1
## 6 virginica Petal.Width 2.5Summary statistics
mydata.long %>%
  group_by(variables, Species) %>%
  summarise(
    n = n(),
    mean = mean(value),
    sd = sd(value)
  ) %>%
  ungroup()
## # A tibble: 12 x 5
## variables Species n mean sd
## <chr> <fct> <int> <dbl> <dbl>
## 1 Petal.Length setosa 50 1.46 0.174
## 2 Petal.Length versicolor 50 4.26 0.470
## 3 Petal.Length virginica 50 5.55 0.552
## 4 Petal.Width setosa 50 0.246 0.105
## 5 Petal.Width versicolor 50 1.33 0.198
## 6 Petal.Width virginica 50 2.03 0.275
## 7 Sepal.Length setosa 50 5.01 0.352
## 8 Sepal.Length versicolor 50 5.94 0.516
## 9 Sepal.Length virginica 50 6.59 0.636
## 10 Sepal.Width setosa 50 3.43 0.379
## 11 Sepal.Width versicolor 50 2.77 0.314
## 12 Sepal.Width virginica 50 2.97 0.322Run T-tests for multiple variables
- Group the data by variables and compare Species groups. Multiple pairwise comparisons between groups are performed.
- Adjust the p-values and add significance levels
stat.test <- mydata.long %>%
  group_by(variables) %>%
  t_test(value ~ Species, p.adjust.method = "bonferroni")
# Remove unnecessary columns and display the outputs
stat.test %>% select(-.y., -statistic, -df)
## # A tibble: 12 x 8
## variables group1 group2 n1 n2 p p.adj p.adj.signif
## * <chr> <chr> <chr> <int> <int> <dbl> <dbl> <chr>
## 1 Petal.Length setosa versicolor 50 50 9.93e-46 2.98e-45 ****
## 2 Petal.Length setosa virginica 50 50 9.27e-50 2.78e-49 ****
## 3 Petal.Length versicolor virginica 50 50 4.90e-22 1.47e-21 ****
## 4 Petal.Width setosa versicolor 50 50 2.72e-47 8.16e-47 ****
## 5 Petal.Width setosa virginica 50 50 2.44e-48 7.32e-48 ****
## 6 Petal.Width versicolor virginica 50 50 2.11e-25 6.33e-25 ****
## 7 Sepal.Length setosa versicolor 50 50 3.75e-17 1.12e-16 ****
## 8 Sepal.Length setosa virginica 50 50 3.97e-25 1.19e-24 ****
## 9 Sepal.Length versicolor virginica 50 50 1.87e- 7 5.61e- 7 ****
## 10 Sepal.Width setosa versicolor 50 50 2.48e-15 7.44e-15 ****
## 11 Sepal.Width setosa virginica 50 50 4.57e- 9 1.37e- 8 ****
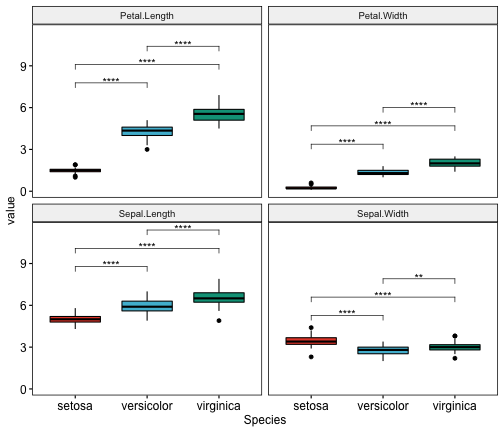
## 12 Sepal.Width versicolor virginica 50 50 2.00e- 3 5.00e- 3 **Create multi-panel Boxplots with t-test p-values
# Create the plot
myplot <- ggboxplot(
  mydata.long, x = "Species", y = "value",
  fill = "Species", palette = "npg", legend = "none",
  ggtheme = theme_pubr(border = TRUE)
  ) +
  facet_wrap(~variables)
# Add statistical test p-values
stat.test <- stat.test %>% add_xy_position(x = "Species")
myplot + stat_pvalue_manual(stat.test, label = "p.adj.signif")
Create individual Box plots with t-test p-values
# Group the data by variables and do a graph for each variable
graphs <- mydata.long %>%
  group_by(variables) %>%
  doo(
    ~ggboxplot(
      data =., x = "Species", y = "value",
      fill = "Species", palette = "npg", legend = "none",
      ggtheme = theme_pubr()
      ),
    result = "plots"
  )
graphs
## # A tibble: 4 x 2
## variables plots
## <chr> <list>
## 1 Petal.Length <gg>
## 2 Petal.Width <gg>
## 3 Sepal.Length <gg>
## 4 Sepal.Width <gg># Add statitistical tests to each corresponding plot
variables <- graphs$variables
plots <- graphs$plots %>% set_names(variables)
for(variable in variables){
stat.test.i <- filter(stat.test, variables == variable)
graph.i <- plots[[variable]] +
labs(title = variable) +
stat_pvalue_manual(stat.test.i, label = "p.adj.signif")
print(graph.i)
}


Recommended for you
This section contains best data science and self-development resources to help you on your path.
Books - Data Science
Our Books
- Practical Guide to Cluster Analysis in R by A. Kassambara (Datanovia)
- Practical Guide To Principal Component Methods in R by A. Kassambara (Datanovia)
- Machine Learning Essentials: Practical Guide in R by A. Kassambara (Datanovia)
- R Graphics Essentials for Great Data Visualization by A. Kassambara (Datanovia)
- GGPlot2 Essentials for Great Data Visualization in R by A. Kassambara (Datanovia)
- Network Analysis and Visualization in R by A. Kassambara (Datanovia)
- Practical Statistics in R for Comparing Groups: Numerical Variables by A. Kassambara (Datanovia)
- Inter-Rater Reliability Essentials: Practical Guide in R by A. Kassambara (Datanovia)
Others
- R for Data Science: Import, Tidy, Transform, Visualize, and Model Data by Hadley Wickham & Garrett Grolemund
- Hands-On Machine Learning with Scikit-Learn, Keras, and TensorFlow: Concepts, Tools, and Techniques to Build Intelligent Systems by Aurelien Géron
- Practical Statistics for Data Scientists: 50 Essential Concepts by Peter Bruce & Andrew Bruce
- Hands-On Programming with R: Write Your Own Functions And Simulations by Garrett Grolemund & Hadley Wickham
- An Introduction to Statistical Learning: with Applications in R by Gareth James et al.
- Deep Learning with R by François Chollet & J.J. Allaire
- Deep Learning with Python by François Chollet
Version:
 Français


Hi! Excellent tutorial website! I saw a discussion at another site saying that before running a pairwise t-test, an ANOVA test should be performed first. It is like the pairwise t-test is a Post hoc test. I am wondering, can I directly analyze my data by pairwise t-test without running an ANOVA?
Thank you for the positive feedback!
If you have multiple groups, then I would go with ANOVA then post-hoc test (if ANOVA is significant).
Every time you conduct a t-test there is a chance that you will make a Type I error (i.e., false positive finding). This error is usually 5%. By running two t-tests on the same data you will have increased your chance of “making a mistake” to 10%. Three t-tests would be about 15% and so on. These are unacceptable errors. An ANOVA controls for these errors so that the Type I error remains at 5% and you can be more confident that any statistically significant result you find is not just running lots of tests.
I got it! Thank you very much for your answer!