
This article describes how to simulate colorblindness vision in production-ready R figures using the colorblinr package. We’ll also present some colorblind-friendly palette.
In some populations, up to 10% of men have color vision deficiencies (cvd).
The R package colorblindr can be used to simulate colorblindness in R. At the time that we write this document (2018-11-20), this package depends on the development versions of cowplot and colorspace.
Contents:
Install colorblindr and dependencies
This section shows how to install colorblindr package and dependencies.
- Install
devtools, which makes it easy to install the developmental version of the other packages
if(require(devtools)) install.packages("devtools")- Install
cowplot
devtools::install_github("wilkelab/cowplot")- Install
colorspace
# for windows use this
install.packages("colorspace", repos = "http://R-Forge.R-project.org")

# Or for MAC OS X /Linux, use this:
URL <- paste0("http://download.r-forge.r-project.org/src/contrib/",
              "colorspace_1.4-0.tar.gz")
devtools::install_url(URL)- Install
colorblindr
devtools::install_github("clauswilke/colorblindr")Load required packages
library(ggplot2)
library(cowplot)
library(colorspace)
library(colorblindr)
Key R functions
Key functions in the colorblindr R package:
cvd_grid(): Create a grid of different color-vision-deficiency simulations of a plot.edit_colors(): Edit colors in existing plot. Can modify colors in existing ggplot2 plots, grid objects, or R base plots provided as recorded plots.scale_colour_OkabeIto()orscale_color_OkabeIto()andscale_fill_OkabeIto(): This is a color-blind friendly, qualitative scale with eight different colors.
Create a basic ggplot
p <- ggplot(iris, aes(Species, Sepal.Length)) +
  geom_boxplot(aes(fill = Species)) +
  theme_minimal() +
  theme(legend.position = "none")
p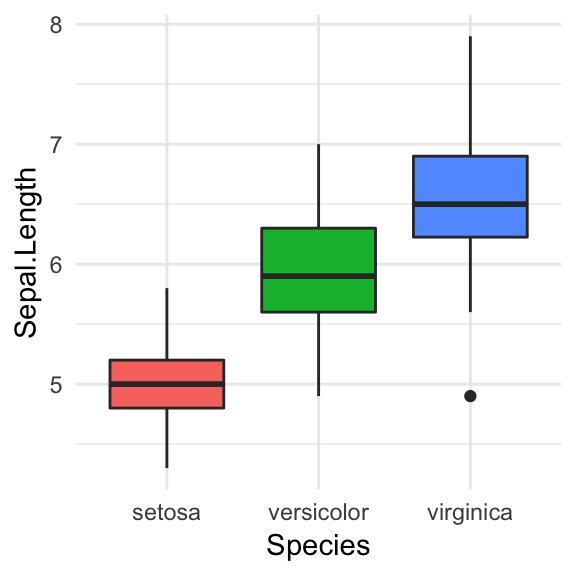
Color-vision-deficiency simulations
The function cvd_grid() can be used to quickly show the most severe forms of each color vision deficiency.
cvd_grid(p)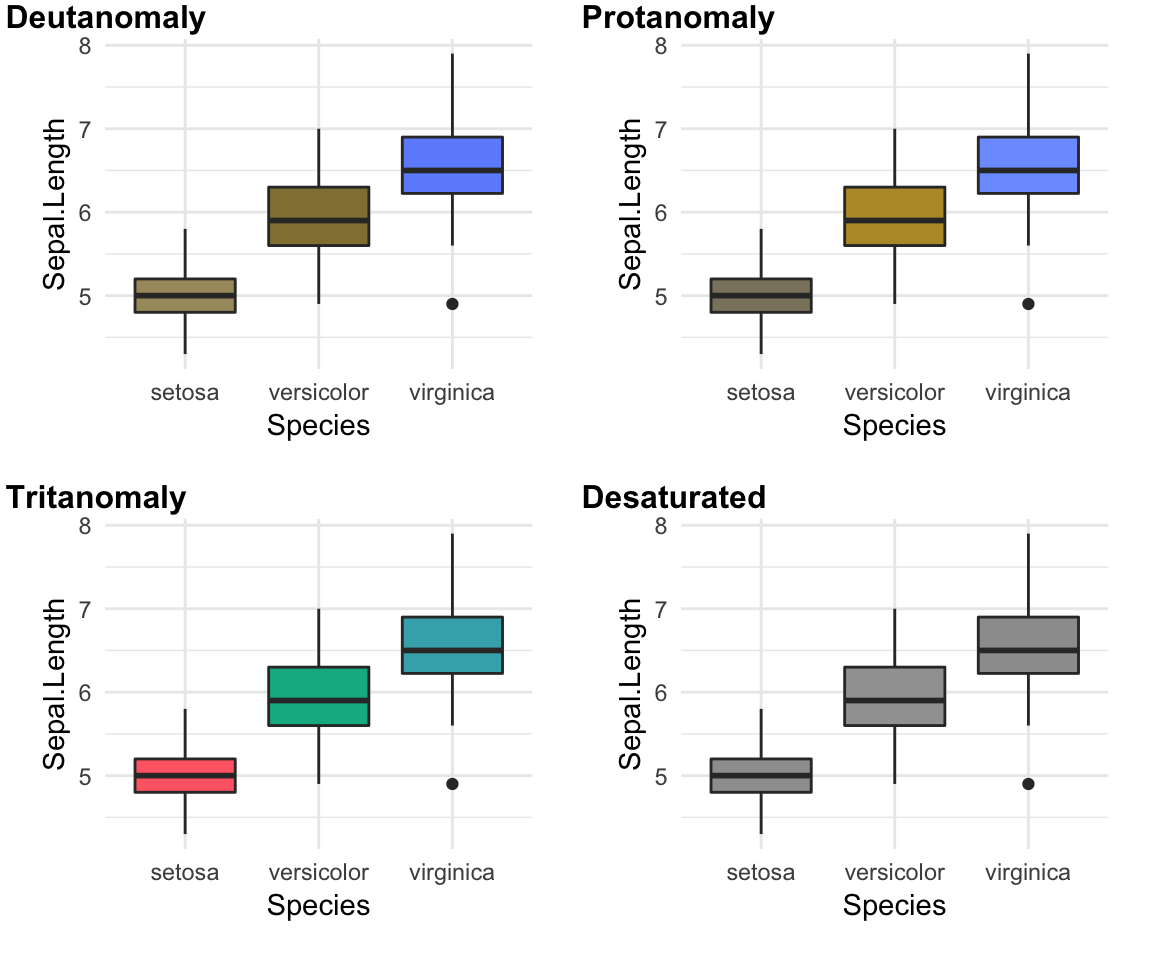
It’s also possible to edit a plot as follow:
# Use deutan, protan or tritan functions [in colorspace]
p2 <- edit_colors(p, deutan, sev = 0.7)
cowplot::plot_grid(p, p2)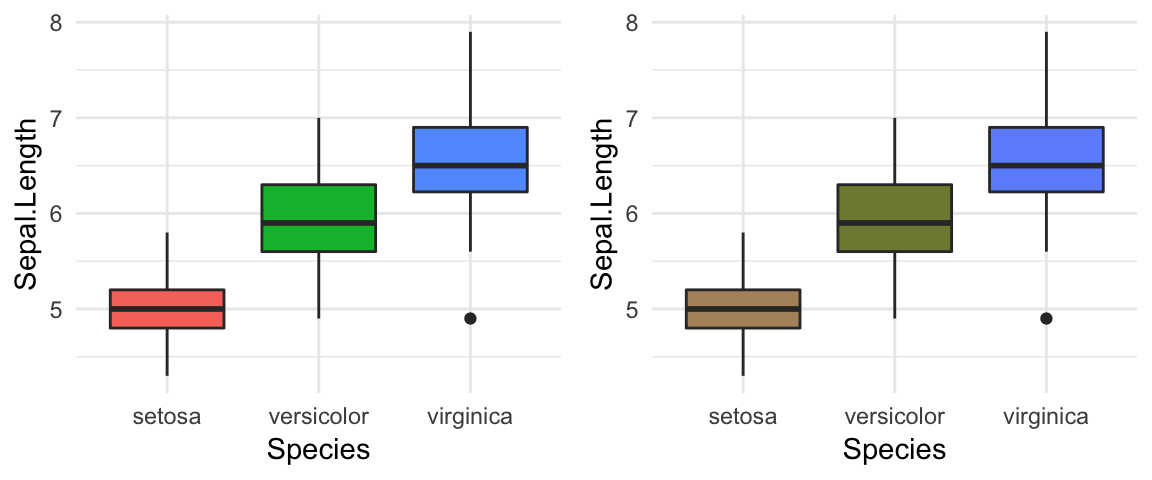
Colorblind-friendly palettes
The colorblindr package comes with a color scale that works better for people with color-vision deficiency. You can use it to modify a ggplot color.
Key functions:
scale_colour_OkabeIto()orscale_color_OkabeIto()scale_fill_OkabeIto()
For example, type this:
# Figure before cvd simulation
p3 <- p + scale_fill_OkabeIto()
p3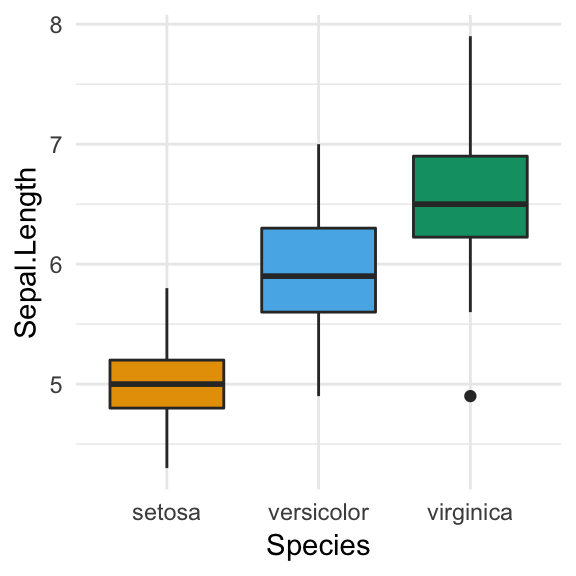
Figure after color-vision-deficiency simulation:
cvd_grid(p3)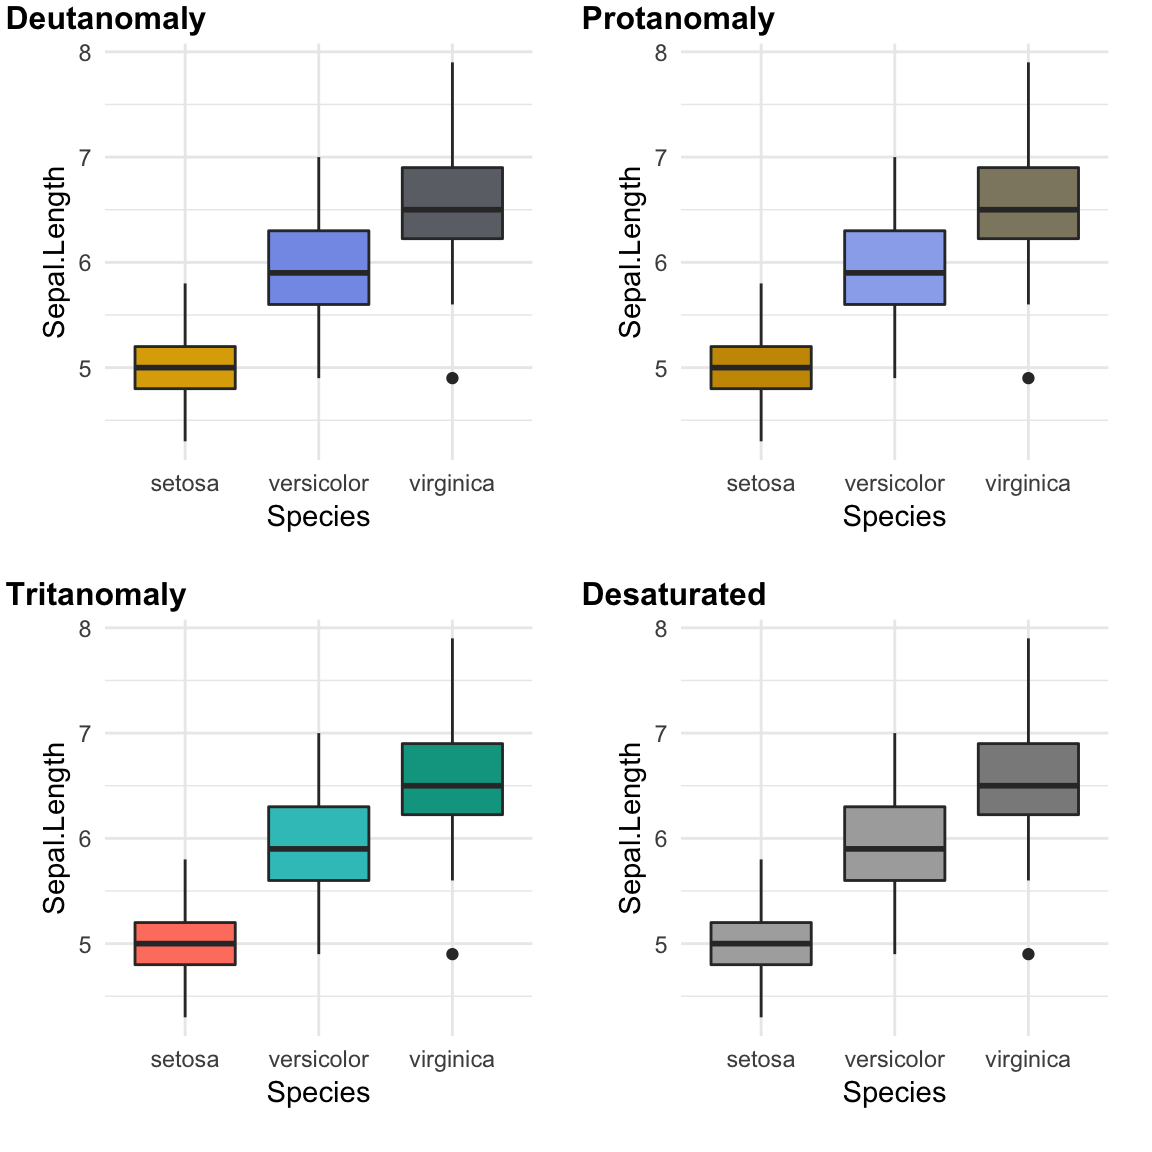
New workflow for figure and image design
- Make figures or images
- Check colors using
cvd_grid() - Iterate color choices until colors are distinguishable in all conditions
Read more at: Color Universal Design (CUD) - How to make figures and presentations that are friendly to Colorblind people
Conclusion
This article introduces how to simulate colorblindness in production-ready figures using the R package colorblindr.
Recommended for you
This section contains best data science and self-development resources to help you on your path.
Books - Data Science
Our Books
- Practical Guide to Cluster Analysis in R by A. Kassambara (Datanovia)
- Practical Guide To Principal Component Methods in R by A. Kassambara (Datanovia)
- Machine Learning Essentials: Practical Guide in R by A. Kassambara (Datanovia)
- R Graphics Essentials for Great Data Visualization by A. Kassambara (Datanovia)
- GGPlot2 Essentials for Great Data Visualization in R by A. Kassambara (Datanovia)
- Network Analysis and Visualization in R by A. Kassambara (Datanovia)
- Practical Statistics in R for Comparing Groups: Numerical Variables by A. Kassambara (Datanovia)
- Inter-Rater Reliability Essentials: Practical Guide in R by A. Kassambara (Datanovia)
Others
- R for Data Science: Import, Tidy, Transform, Visualize, and Model Data by Hadley Wickham & Garrett Grolemund
- Hands-On Machine Learning with Scikit-Learn, Keras, and TensorFlow: Concepts, Tools, and Techniques to Build Intelligent Systems by Aurelien Géron
- Practical Statistics for Data Scientists: 50 Essential Concepts by Peter Bruce & Andrew Bruce
- Hands-On Programming with R: Write Your Own Functions And Simulations by Garrett Grolemund & Hadley Wickham
- An Introduction to Statistical Learning: with Applications in R by Gareth James et al.
- Deep Learning with R by François Chollet & J.J. Allaire
- Deep Learning with Python by François Chollet
Version:
 Français


I believe you mean simulate, not stimulate.