This article describes the different pch in R for modifying the point symbols of an R base plot. The option pch is used to specify point symbols in the functions plot() and lines().
In this tutorial, you’ll learn how to:
- Display easily the list of pch in R. The R function
ggpubr::show_point_shapes()can be used to show the 25 commonly used R pch values. - Change the R base plot pch symbols and appearance. Additionally, we provide R codes to modify the plot pch size and pch color, as well as, the legend pch. key arguments in
plot()function:pch: numeric values (from 0 to 25) or character symbols (“+”, “.”, “;”, etc) specifying the point symbols (or shapes).cex: numeric values indicating the point size.col: color name for points.
- Control pch types by groups.
- Use special pch types, including pch 21 and pch 24. The interesting feature of these pch codes is that you can change their background fill color and, their border line type and color.
Contents:
Key R functions
plot(x, y, pch = 19, col = "black", cex = 1): Base R plot function to create a scatter plot.
List of pch symbols
The most commonly used pch values in R, include:
- pch = 0, square
- pch = 1, circle
- pch = 2, triangle point up
- pch = 3, plus
- pch = 4, cross
- pch = 5, diamond
- pch = 6, triangle point down
- pch = 7, square cross
- pch = 8, star
- pch = 9, diamond plus
- pch = 10, circle plus
- pch = 11, triangles up and down
- pch = 12, square plus
- pch = 13, circle cross
- pch = 14, square and triangle down
- pch = 15, filled square
- pch = 16, filled circle
- pch = 17, filled triangle point-up
- pch = 18, filled diamond
- pch = 19, solid circle
- pch = 20, bullet (smaller circle)
- pch = 21, filled circle blue
- pch = 22, filled square blue
- pch = 23, filled diamond blue
- pch = 24, filled triangle point-up blue
- pch = 25, filled triangle point down blue
The function below illustrates the different pch values. First install the ggpubr package (install.packages("ggpubr")), and then type this:
ggpubr::show_point_shapes()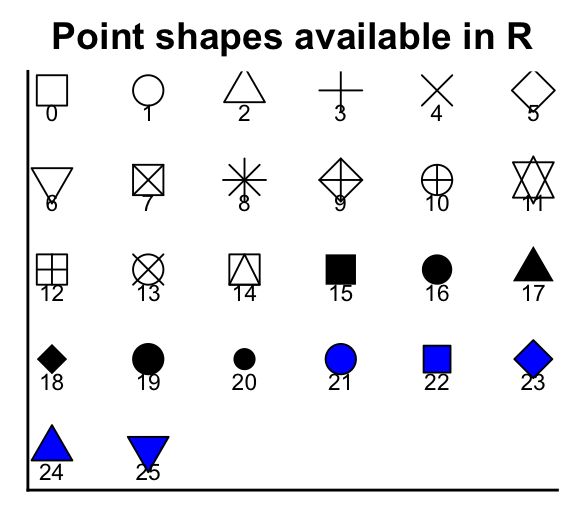
Note that,
- points can be omitted from the plot using pch = NA.
- Other different characters symbols can be used to specify the pch argument, including “+”, “*“,”-“,”.“,”#, “%”, “o”.
- pch options from pch 21 to 25 are open symbols that can be filled by a color.
Demo dataset
We’ll use the R built-in datasets: iris.
head(iris, 3)## Sepal.Length Sepal.Width Petal.Length Petal.Width Species
## 1 5.1 3.5 1.4 0.2 setosa
## 2 4.9 3.0 1.4 0.2 setosa
## 3 4.7 3.2 1.3 0.2 setosaChange R base plot point shapes
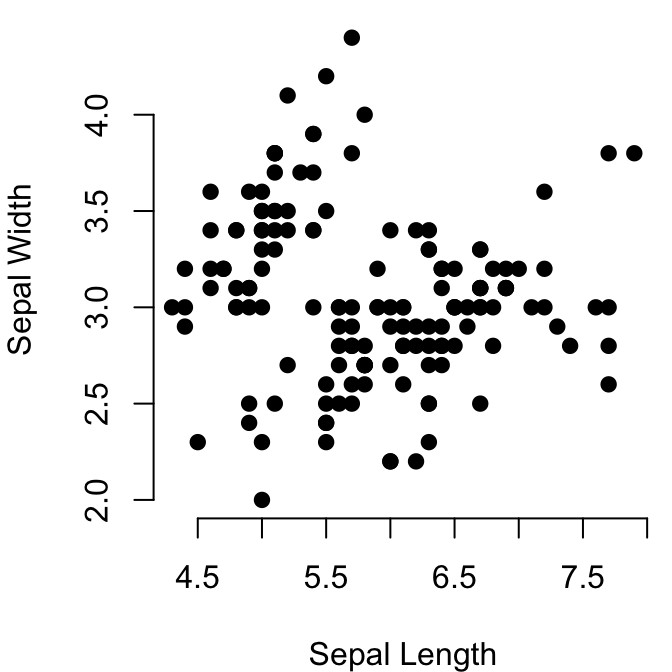
The default R plot pch symbol is 1, which is an empty circle. You can change this to pch = 19 (solid circle) or to pch = 21 (filled circle).
For example:
# Default plot pch = 1 (empty circle)
plot(x = iris$Sepal.Length, y = iris$Sepal.Width, frame = FALSE,
     xlab = "Sepal Length", ylab = "Sepal Width")

# Change plot symbol to pch = 19 (solid circle)
plot(x = iris$Sepal.Length, y = iris$Sepal.Width, frame = FALSE,
     xlab = "Sepal Length", ylab = "Sepal Width",
     pch = 19)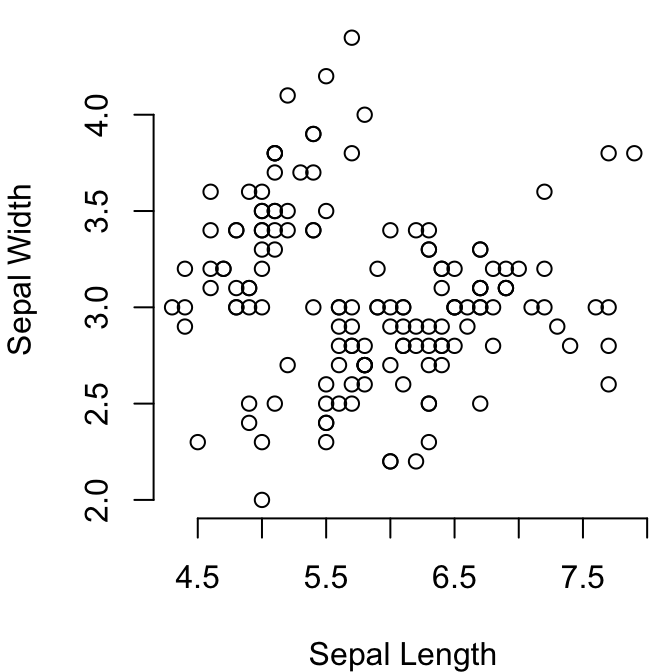
To change the color and the size of points, use the following arguments:
col: color (hexadecimal color code or color name). For example,col = "blue"orcol = "#4F6228".cex: the size of point symbols. Numeric values.
For the filled pch symbols (21 to 25), you can use additional plot options to modify the points background color (bg) and the border line width (lwd):
bg: the background (or fill) color for the open plot symbols (21 to 25).lwd: Numeric values indicating the line width of the plotting symbols border.
# Change color
plot(x = iris$Sepal.Length, y = iris$Sepal.Width, frame = FALSE,
xlab = "Sepal Length", ylab = "Sepal Width",
pch = 19, col = "#0073C2FF")
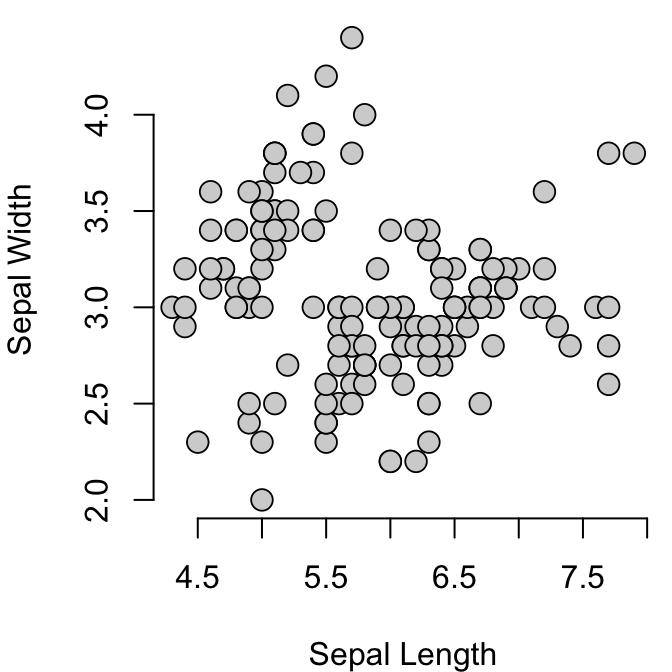
# Use pch = 21
# Change border line width (lwd), and background color (bg)
plot(x = iris$Sepal.Length, y = iris$Sepal.Width, frame = FALSE,
xlab = "Sepal Length", ylab = "Sepal Width",
pch = 21, bg = "lightgray", col = "black",
lwd = 0.9, cex = 1.5)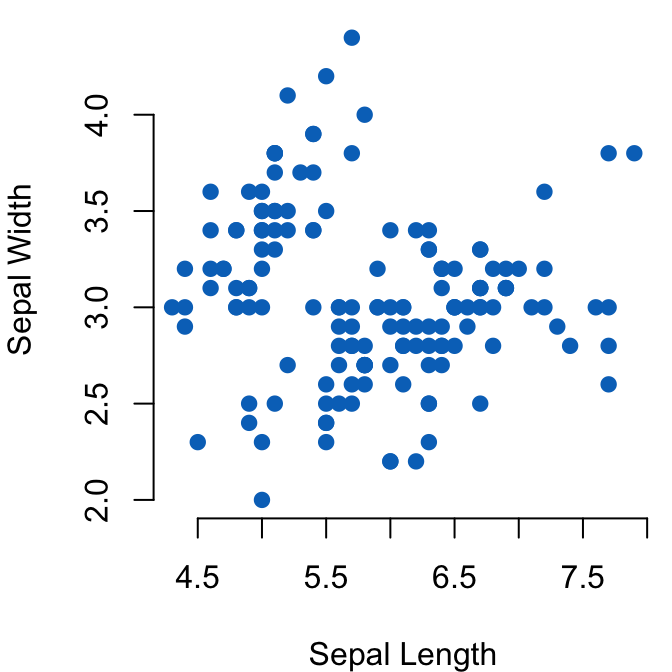
Note that point color and pch can be also a vector. For example, you might want to change point colors and shapes by groups:
# Define color for each of the 3 iris species
colors <- c("#00AFBB", "#E7B800", "#FC4E07")
colors <- colors[as.numeric(iris$Species)]

# Define shapes
shapes = c(16, 17, 18)
shapes <- shapes[as.numeric(iris$Species)]

# Plot
plot(x = iris$Sepal.Length, y = iris$Sepal.Width, frame = FALSE,
     xlab = "Sepal Length", ylab = "Sepal Width",
     col = colors, pch = shapes)
legend("topright", legend = levels(iris$Species),
      col =  c("#00AFBB", "#E7B800", "#FC4E07"),
      pch = c(16, 17, 18) )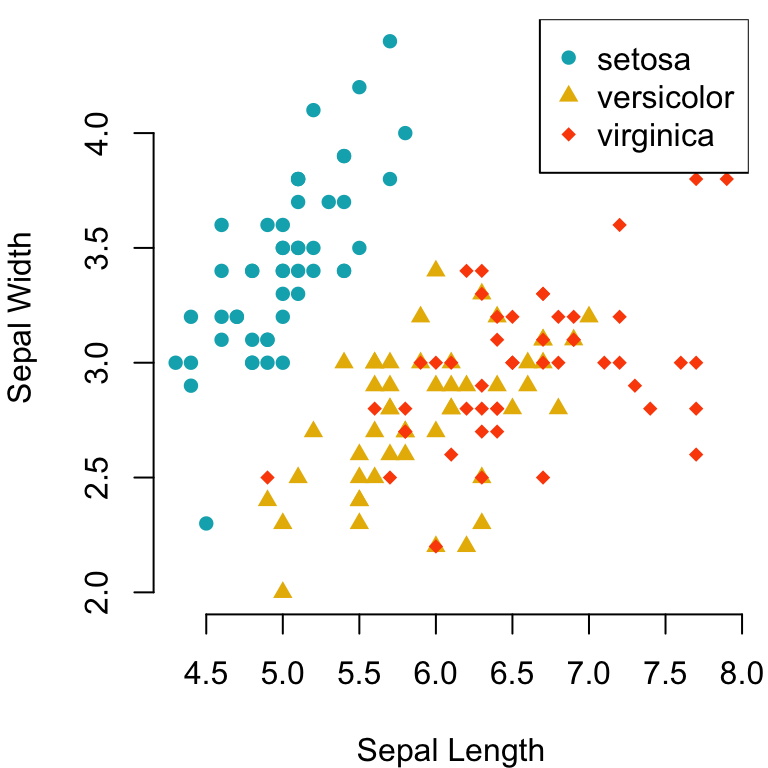
Conclusion
This article describes the different point shapes (or pch symbols) available in R.
- Display the different point symbols in R:
ggpubr::show_point_shapes()- Change point symbols in R base plots. Use pch, cex and col to change, respectively, the symbols, the size and the color of points in R base plots:
plot(x = iris$Sepal.Length, y = iris$Sepal.Width, frame = FALSE,
     xlab = "Sepal Length", ylab = "Sepal Width",
     pch = 19, cex = 1, col = "#00AFBB")
Recommended for you
This section contains best data science and self-development resources to help you on your path.
Books - Data Science
Our Books
- Practical Guide to Cluster Analysis in R by A. Kassambara (Datanovia)
- Practical Guide To Principal Component Methods in R by A. Kassambara (Datanovia)
- Machine Learning Essentials: Practical Guide in R by A. Kassambara (Datanovia)
- R Graphics Essentials for Great Data Visualization by A. Kassambara (Datanovia)
- GGPlot2 Essentials for Great Data Visualization in R by A. Kassambara (Datanovia)
- Network Analysis and Visualization in R by A. Kassambara (Datanovia)
- Practical Statistics in R for Comparing Groups: Numerical Variables by A. Kassambara (Datanovia)
- Inter-Rater Reliability Essentials: Practical Guide in R by A. Kassambara (Datanovia)
Others
- R for Data Science: Import, Tidy, Transform, Visualize, and Model Data by Hadley Wickham & Garrett Grolemund
- Hands-On Machine Learning with Scikit-Learn, Keras, and TensorFlow: Concepts, Tools, and Techniques to Build Intelligent Systems by Aurelien Géron
- Practical Statistics for Data Scientists: 50 Essential Concepts by Peter Bruce & Andrew Bruce
- Hands-On Programming with R: Write Your Own Functions And Simulations by Garrett Grolemund & Hadley Wickham
- An Introduction to Statistical Learning: with Applications in R by Gareth James et al.
- Deep Learning with R by François Chollet & J.J. Allaire
- Deep Learning with Python by François Chollet
Version:
 Français


If you want to convert a string to numeric, it´s better to use as.factor, instead of as.numeric
Thank you for your input. Note that the variable “iris$Species” is already a factor