The Friedman test is a non-parametric alternative to the one-way repeated measures ANOVA test. It extends the Sign test in the situation where there are more than two groups to compare.
Friedman test is used to assess whether there are any statistically significant differences between the distributions of three or more paired groups. It’s recommended when the normality assumptions of the one-way repeated measures ANOVA test is not met or when the dependent variable is measured on an ordinal scale.
In this chapter, you’ll learn how to:
- Compute Friedman test in R
- Perform multiple pairwise-comparison between groups, to identify which pairs of groups are significantly different.
- Determine the effect size of Friedman test using the Kendall’s W.
Contents:
Related Book
Practical Statistics in R II - Comparing Groups: Numerical VariablesPrerequisites
Make sure you have installed the following R packages:
tidyversefor data manipulation and visualizationggpubrfor creating easily publication ready plotsrstatixprovides pipe-friendly R functions for easy statistical analyses.
Load the packages:
library(tidyverse)
library(ggpubr)
library(rstatix)
Data preparation
We’ll use the self esteem score dataset measured over three time points. The data is available in the datarium package.
data("selfesteem", package = "datarium")
head(selfesteem, 3)
## # A tibble: 3 x 4
## id t1 t2 t3
## <int> <dbl> <dbl> <dbl>
## 1 1 4.01 5.18 7.11
## 2 2 2.56 6.91 6.31
## 3 3 3.24 4.44 9.78Gather columns t1, t2 and t3 into long format. Convert id and time variables into factor (or grouping) variables:
selfesteem <- selfesteem %>%
  gather(key = "time", value = "score", t1, t2, t3) %>%
  convert_as_factor(id, time)
head(selfesteem, 3)
## # A tibble: 3 x 3
## id time score
## <fct> <fct> <dbl>
## 1 1 t1 4.01
## 2 2 t1 2.56
## 3 3 t1 3.24Summary statistics
Compute some summary statistics of the self-esteem score by groups (time):
selfesteem %>%
  group_by(time) %>%
  get_summary_stats(score, type = "common")
## # A tibble: 3 x 11
## time variable n min max median iqr mean sd se ci
## <fct> <chr> <dbl> <dbl> <dbl> <dbl> <dbl> <dbl> <dbl> <dbl> <dbl>
## 1 t1 score 10 2.05 4.00 3.21 0.571 3.14 0.552 0.174 0.395
## 2 t2 score 10 3.91 6.91 4.60 0.89 4.93 0.863 0.273 0.617
## 3 t3 score 10 6.31 9.78 7.46 1.74 7.64 1.14 0.361 0.817Visualization
Create a box plot and add points corresponding to individual values
ggboxplot(selfesteem, x = "time", y = "score", add = "jitter")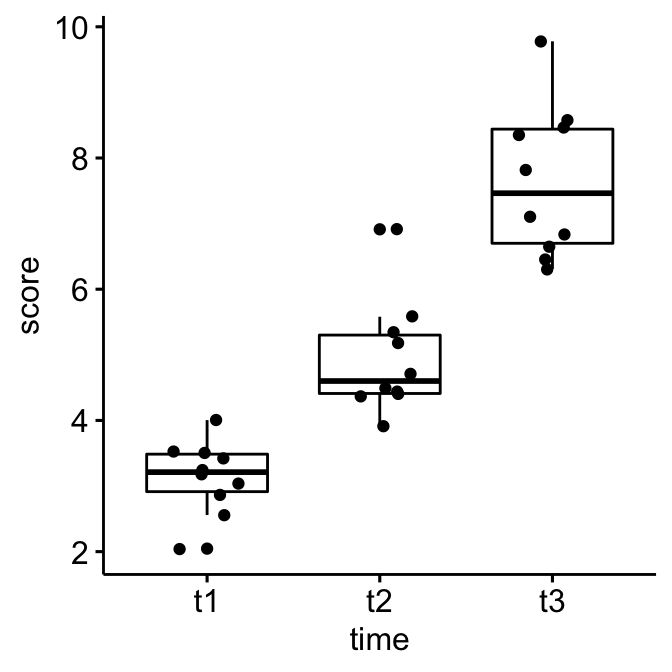
Computation
We’ll use the pipe-friendly friedman_test() function [rstatix package], a wrapper around the R base function friedman.test().
res.fried <- selfesteem %>% friedman_test(score ~ time |id)
res.fried
## # A tibble: 1 x 6
## .y. n statistic df p method
## * <chr> <int> <dbl> <dbl> <dbl> <chr>
## 1 score 10 18.2 2 0.000112 Friedman testThe self esteem score was statistically significantly different at the different time points during the diet, X2(2) = 18.2, p = 0.0001.
Effect size
The Kendall’s W can be used as the measure of the Friedman test effect size. It is calculated as follow : W = X2/N(K-1); where W is the Kendall’s W value; X2 is the Friedman test statistic value; N is the sample size. k is the number of measurements per subject (M. T. Tomczak and Tomczak 2014).
The Kendall’s W coefficient assumes the value from 0 (indicating no relationship) to 1 (indicating a perfect relationship).
Kendall’s W uses the Cohen’s interpretation guidelines of 0.1 - < 0.3 (small effect), 0.3 - < 0.5 (moderate effect) and >= 0.5 (large effect). Confidence intervals are calculated by bootstap.
selfesteem %>% friedman_effsize(score ~ time |id)## # A tibble: 1 x 5
## .y. n effsize method magnitude
## * <chr> <int> <dbl> <chr> <ord>
## 1 score 10 0.910 Kendall W largeA large effect size is detected, W = 0.91.
Multiple pairwise-comparisons
From the output of the Friedman test, we know that there is a significant difference between groups, but we don’t know which pairs of groups are different.
A significant Friedman test can be followed up by pairwise Wilcoxon signed-rank tests for identifying which groups are different.
Note that, the data must be correctly ordered by the blocking variable (id) so that the first observation for time t1 will be paired with the first observation for time t2, and so on.
Pairwise comparisons using paired Wilcoxon signed-rank test. P-values are adjusted using the Bonferroni multiple testing correction method.
# pairwise comparisons
pwc <- selfesteem %>%
  wilcox_test(score ~ time, paired = TRUE, p.adjust.method = "bonferroni")
pwc
## # A tibble: 3 x 9
## .y. group1 group2 n1 n2 statistic p p.adj p.adj.signif
## * <chr> <chr> <chr> <int> <int> <dbl> <dbl> <dbl> <chr>
## 1 score t1 t2 10 10 0 0.002 0.006 **
## 2 score t1 t3 10 10 0 0.002 0.006 **
## 3 score t2 t3 10 10 1 0.004 0.012 *All the pairwise differences are statistically significant.
Note that, it is also possible to perform pairwise comparisons using Sign Test, which may lack power in detecting differences in paired data sets. However, it is useful because it has few assumptions about the distributions of the data to compare.
Pairwise comparisons using sign test:
pwc2 <- selfesteem %>%
  sign_test(score ~ time, p.adjust.method = "bonferroni")
pwc2
Report
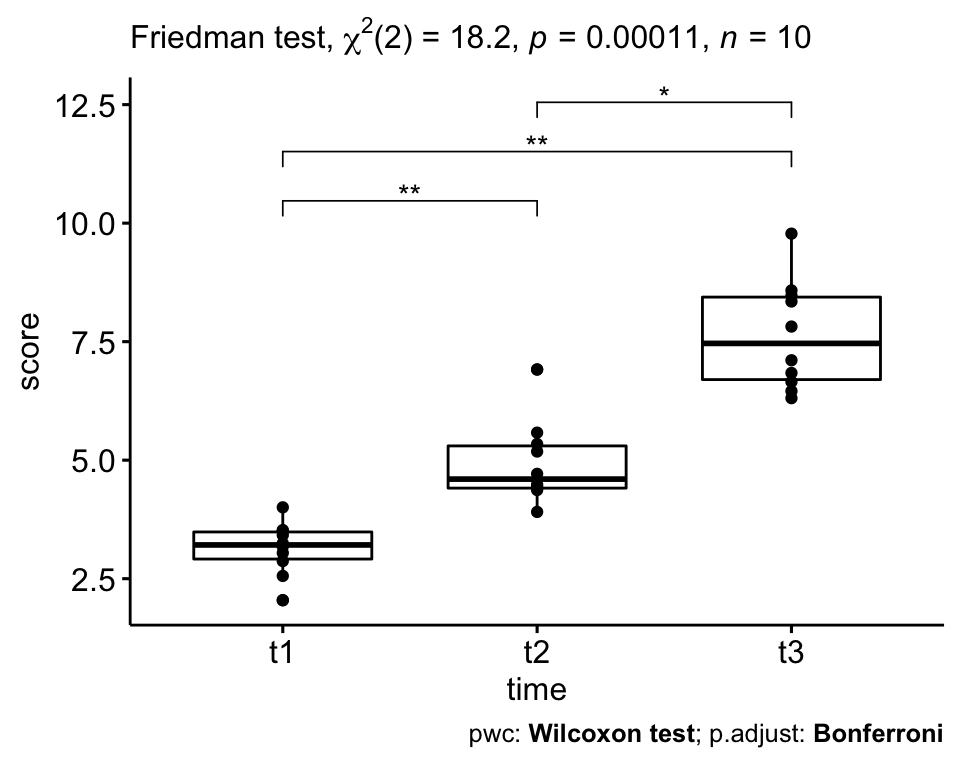
The self-esteem score was statistically significantly different at the different time points using Friedman test, X2(2) = 18.2, p = 0.00011.
Pairwise Wilcoxon signed rank test between groups revealed statistically significant differences in self esteem score between t1 and t2 (p = 0.006); t1 and t3 (0.006); t2 and t3 (0.012).
# Visualization: box plots with p-values
pwc <- pwc %>% add_xy_position(x = "time")
ggboxplot(selfesteem, x = "time", y = "score", add = "point") +
  stat_pvalue_manual(pwc, hide.ns = TRUE) +
  labs(
    subtitle = get_test_label(res.fried,  detailed = TRUE),
    caption = get_pwc_label(pwc)
  )
References
Tomczak, Maciej T., and Ewa Tomczak. 2014. “The Need to Report Effect Size Estimates Revisited. an Overview of Some Recommended Measures of Effect Size.” Trends in SportSciences.
Recommended for you
This section contains best data science and self-development resources to help you on your path.
Books - Data Science
Our Books
- Practical Guide to Cluster Analysis in R by A. Kassambara (Datanovia)
- Practical Guide To Principal Component Methods in R by A. Kassambara (Datanovia)
- Machine Learning Essentials: Practical Guide in R by A. Kassambara (Datanovia)
- R Graphics Essentials for Great Data Visualization by A. Kassambara (Datanovia)
- GGPlot2 Essentials for Great Data Visualization in R by A. Kassambara (Datanovia)
- Network Analysis and Visualization in R by A. Kassambara (Datanovia)
- Practical Statistics in R for Comparing Groups: Numerical Variables by A. Kassambara (Datanovia)
- Inter-Rater Reliability Essentials: Practical Guide in R by A. Kassambara (Datanovia)
Others
- R for Data Science: Import, Tidy, Transform, Visualize, and Model Data by Hadley Wickham & Garrett Grolemund
- Hands-On Machine Learning with Scikit-Learn, Keras, and TensorFlow: Concepts, Tools, and Techniques to Build Intelligent Systems by Aurelien Géron
- Practical Statistics for Data Scientists: 50 Essential Concepts by Peter Bruce & Andrew Bruce
- Hands-On Programming with R: Write Your Own Functions And Simulations by Garrett Grolemund & Hadley Wickham
- An Introduction to Statistical Learning: with Applications in R by Gareth James et al.
- Deep Learning with R by François Chollet & J.J. Allaire
- Deep Learning with Python by François Chollet
Version:
 Français

Hi! thanks for your article, anyway I am stuck at one point, right when I try to run the friedman_test() function: at this point, I got an error message “not an unreplicated complete block design”
Do you know what could cause such an error?
Hi, please make sure that your data is correctly formatted as the demo data provide here
Hi. When I try to run the Friedman test I get the same error as Pytchi, namely, “not an unreplicated complete block design”. I have formatted my data as in the example with exactly one observation for each combination of grouping factors.
I am getting the same error as another used has posted: “not an unreplicated complete block design”. I have made sure my data is formatted as in the example.
Would you please provide a reproducible R code as described at: Publish Reproducible Examples from R to Datanovia Website ?
This issue has been resolved at Friedman test unreplicated complete block design error
Thank you for your input, appreciated!
Hello,
Actually, the solutions presented in the MSalena’s link (i.e., class type as factor NOR a “better” ordering NOR change the dataframe into matrix NOR the presences of NAs) do not solve the problem of “unreplicated complete block design”.
Essentially, the issue is that unreplicated complete block design means that each subject has ONLY 1 observation per each experimental condition.
Therefore, if you have several observations per each experimental condition, you must get a central tendency first (mean or median).
I myself have 15 observations per 3 experimental conditions (hence 5 observations per each condition). When I try to perform the Friedman test on my “raw” data, I get the error message of unreplicated complete block design. But when I average the five values, the error disappears.
Hope this helps someone in the future.
@Kassambara, please correct me if I am wrong and thanks for creating such a useful website!
Cheers,
Andrii
Thank you for the amazing tutorials!
Unfortunately I am stuck with the visualisation: when entering
pwc % add_xy_position(x = “time”)
I get the following error:
Error: `x` must be a vector, not a `tbl_df/tbl/data.frame/rstatix_test/wilcox_test` object.
Please make sure you have installed the latest version of the rstatix package
Hi, do you know why when I do the box plot with the p-values I get Error in.valide_y_position (y.position, data):
can’t find the y.position variable ‘y.position’ in the data??
Why is Nemenyi Post-hoc Test not done or is the Wilcoxon signed rank test a substitute to that
Hey. Great tutorial!
I am comparing five groups with the Wilcoxon test and have quite many significant differences, so the plot looks very messy.
Is there a way to visualize the pairwise comparison results using the lettering with your approach?
Hi, thanks for this helfpul tutorial. It was working perfectly for me until I recently updated my R to version 4.0.5, and reinstalled the packages. Now, when I run the friedmans test, I get the error: Error in UseMethod(“friedman_test”) :
no applicable method for ‘friedman_test’ applied to an object of class “data.frame”. Do you know how to resolve this issue? Many thanks, Laura
Hi! Thank you so much for the tutorial 🙂
I have understood that several people recommend Dunn’s posthoc test for pairwise comparisons. What was your rationale for choosing Wilcoxon signed-rank?