Kruskal-Wallis test is a non-parametric alternative to the one-way ANOVA test. It extends the two-samples Wilcoxon test in the situation where there are more than two groups to compare. It’s recommended when the assumptions of one-way ANOVA test are not met.
This chapter describes how to compute the Kruskal-Wallis test using the R software. You will also learn how to calculate the effect size based on kruskal-Wallis H-statistic.
Contents:
Related Book
Practical Statistics in R II - Comparing Groups: Numerical VariablesPrerequisites
Make sure you have installed the following R packages:
tidyversefor data manipulation and visualizationggpubrfor creating easily publication ready plotsrstatixprovides pipe-friendly R functions for easy statistical analyses.
Load the packages:
library(tidyverse)
library(ggpubr)
library(rstatix)
Data preparation
Here, we’ll use the built-in R data set named PlantGrowth. It contains the weight of plants obtained under a control and two different treatment conditions.
set.seed(1234)
PlantGrowth %>% sample_n_by(group, size = 1)
## # A tibble: 3 x 2
## weight group
## <dbl> <fct>
## 1 5.58 ctrl
## 2 6.03 trt1
## 3 4.92 trt2- Re-order the group levels:
PlantGrowth <- PlantGrowth %>%
  reorder_levels(group, order = c("ctrl", "trt1", "trt2"))
summary statistics
Compute summary statistics by groups:
PlantGrowth %>%
  group_by(group) %>%
  get_summary_stats(weight, type = "common")
## # A tibble: 3 x 11
## group variable n min max median iqr mean sd se ci
## <fct> <chr> <dbl> <dbl> <dbl> <dbl> <dbl> <dbl> <dbl> <dbl> <dbl>
## 1 ctrl weight 10 4.17 6.11 5.16 0.743 5.03 0.583 0.184 0.417
## 2 trt1 weight 10 3.59 6.03 4.55 0.662 4.66 0.794 0.251 0.568
## 3 trt2 weight 10 4.92 6.31 5.44 0.467 5.53 0.443 0.14 0.317Visualization
Create a box plot of weight by group:
ggboxplot(PlantGrowth, x = "group", y = "weight")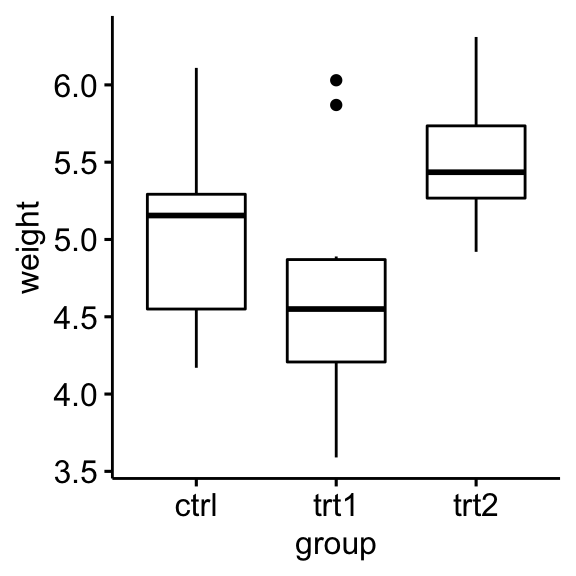
Computation
Question: We want to know if there is any significant difference between the average weights of plants in the 3 experimental conditions.
We’ll use the pipe-friendly kruskal_test() function [rstatix package], a wrapper around the R base function kruskal.test().
res.kruskal <- PlantGrowth %>% kruskal_test(weight ~ group)
res.kruskal
## # A tibble: 1 x 6
## .y. n statistic df p method
## * <chr> <int> <dbl> <int> <dbl> <chr>
## 1 weight 30 7.99 2 0.0184 Kruskal-WallisEffect size
The eta squared, based on the H-statistic, can be used as the measure of the Kruskal-Wallis test effect size. It is calculated as follow : eta2[H] = (H - k + 1)/(n - k); where H is the value obtained in the Kruskal-Wallis test; k is the number of groups; n is the total number of observations (M. T. Tomczak and Tomczak 2014).
The eta-squared estimate assumes values from 0 to 1 and multiplied by 100 indicates the percentage of variance in the dependent variable explained by the independent variable.
The interpretation values commonly in published literature are: 0.01- < 0.06 (small effect), 0.06 - < 0.14 (moderate effect) and >= 0.14 (large effect).
PlantGrowth %>% kruskal_effsize(weight ~ group)## # A tibble: 1 x 5
## .y. n effsize method magnitude
## * <chr> <int> <dbl> <chr> <ord>
## 1 weight 30 0.222 eta2[H] largeA large effect size is detected, eta2[H] = 0.22.
Multiple pairwise-comparisons
From the output of the Kruskal-Wallis test, we know that there is a significant difference between groups, but we don’t know which pairs of groups are different.
A significant Kruskal-Wallis test is generally followed up by Dunn’s test to identify which groups are different. It’s also possible to use the Wilcoxon’s test to calculate pairwise comparisons between group levels with corrections for multiple testing.
Compared to the Wilcoxon’s test, the Dunn’s test takes into account the rankings used by the Kruskal-Wallis test. It also does ties adjustments.
- Pairwise comparisons using Dunn’s test:
# Pairwise comparisons
pwc <- PlantGrowth %>%
  dunn_test(weight ~ group, p.adjust.method = "bonferroni")
pwc
## # A tibble: 3 x 9
## .y. group1 group2 n1 n2 statistic p p.adj p.adj.signif
## * <chr> <chr> <chr> <int> <int> <dbl> <dbl> <dbl> <chr>
## 1 weight ctrl trt1 10 10 -1.12 0.264 0.791 ns
## 2 weight ctrl trt2 10 10 1.69 0.0912 0.273 ns
## 3 weight trt1 trt2 10 10 2.81 0.00500 0.0150 *- Pairwise comparisons using Wilcoxon’s test:
pwc2 <- PlantGrowth %>%
  wilcox_test(weight ~ group, p.adjust.method = "bonferroni")
pwc2
## # A tibble: 3 x 9
## .y. group1 group2 n1 n2 statistic p p.adj p.adj.signif
## * <chr> <chr> <chr> <int> <int> <dbl> <dbl> <dbl> <chr>
## 1 weight ctrl trt1 10 10 67.5 0.199 0.597 ns
## 2 weight ctrl trt2 10 10 25 0.063 0.189 ns
## 3 weight trt1 trt2 10 10 16 0.009 0.027 *The pairwise comparison shows that, only trt1 and trt2 are significantly different (Wilcoxon’s test, p = 0.027).
Report
There was a statistically significant differences between treatment groups as assessed using the Kruskal-Wallis test (p = 0.018). Pairwise Wilcoxon test between groups showed that only the difference between trt1 and trt2 group was significant (Wilcoxon’s test, p = 0.027)
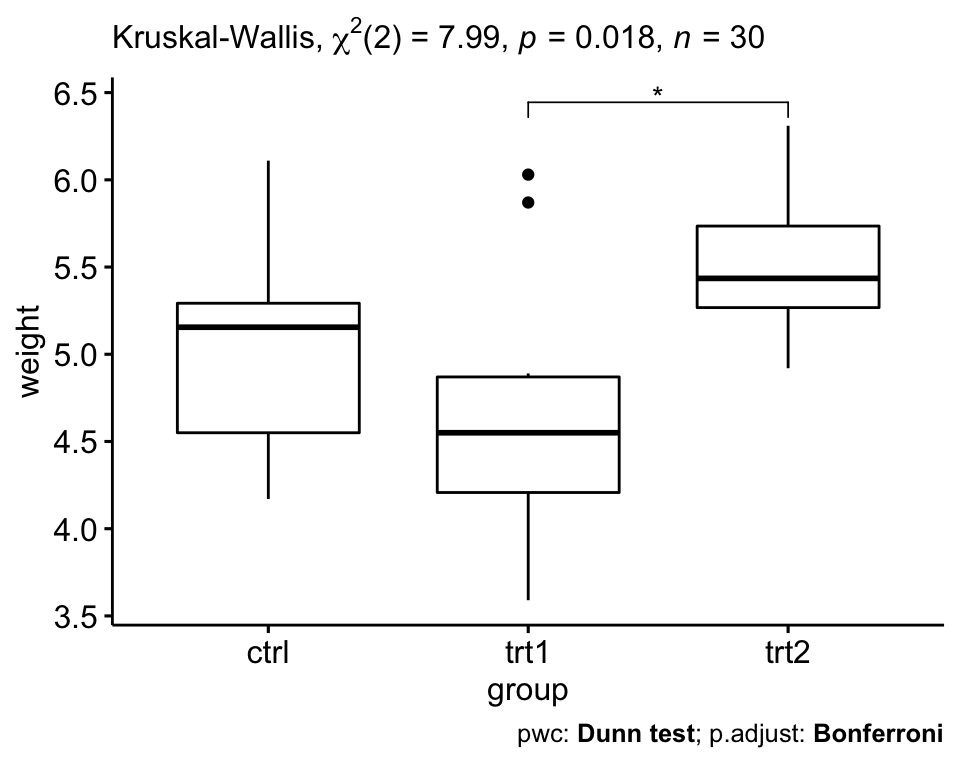
# Visualization: box plots with p-values
pwc <- pwc %>% add_xy_position(x = "group")
ggboxplot(PlantGrowth, x = "group", y = "weight") +
  stat_pvalue_manual(pwc, hide.ns = TRUE) +
  labs(
    subtitle = get_test_label(res.kruskal, detailed = TRUE),
    caption = get_pwc_label(pwc)
    )
References
Tomczak, Maciej T., and Ewa Tomczak. 2014. “The Need to Report Effect Size Estimates Revisited. an Overview of Some Recommended Measures of Effect Size.” Trends in SportSciences.
Recommended for you
This section contains best data science and self-development resources to help you on your path.
Books - Data Science
Our Books
- Practical Guide to Cluster Analysis in R by A. Kassambara (Datanovia)
- Practical Guide To Principal Component Methods in R by A. Kassambara (Datanovia)
- Machine Learning Essentials: Practical Guide in R by A. Kassambara (Datanovia)
- R Graphics Essentials for Great Data Visualization by A. Kassambara (Datanovia)
- GGPlot2 Essentials for Great Data Visualization in R by A. Kassambara (Datanovia)
- Network Analysis and Visualization in R by A. Kassambara (Datanovia)
- Practical Statistics in R for Comparing Groups: Numerical Variables by A. Kassambara (Datanovia)
- Inter-Rater Reliability Essentials: Practical Guide in R by A. Kassambara (Datanovia)
Others
- R for Data Science: Import, Tidy, Transform, Visualize, and Model Data by Hadley Wickham & Garrett Grolemund
- Hands-On Machine Learning with Scikit-Learn, Keras, and TensorFlow: Concepts, Tools, and Techniques to Build Intelligent Systems by Aurelien Géron
- Practical Statistics for Data Scientists: 50 Essential Concepts by Peter Bruce & Andrew Bruce
- Hands-On Programming with R: Write Your Own Functions And Simulations by Garrett Grolemund & Hadley Wickham
- An Introduction to Statistical Learning: with Applications in R by Gareth James et al.
- Deep Learning with R by François Chollet & J.J. Allaire
- Deep Learning with Python by François Chollet
Version:
 Français

No Comments