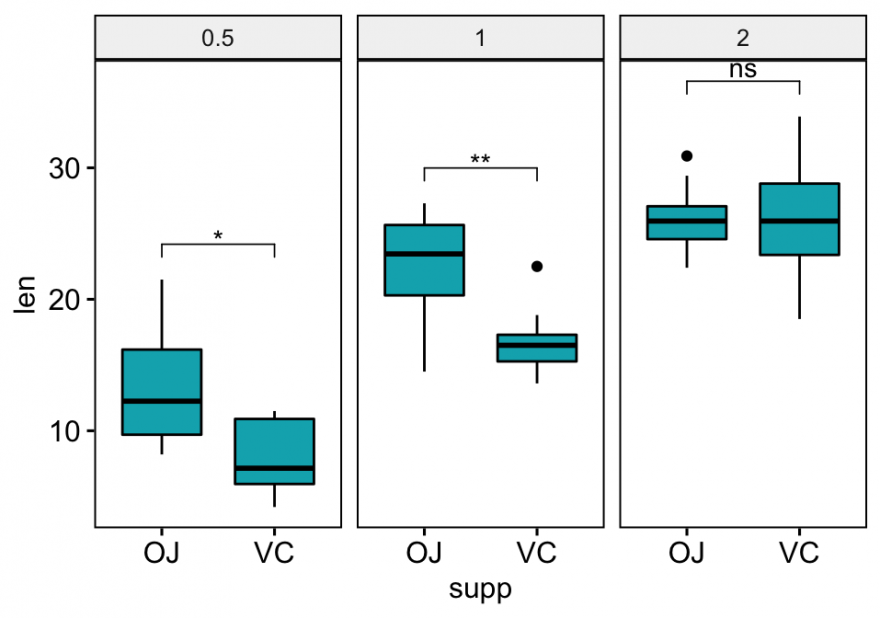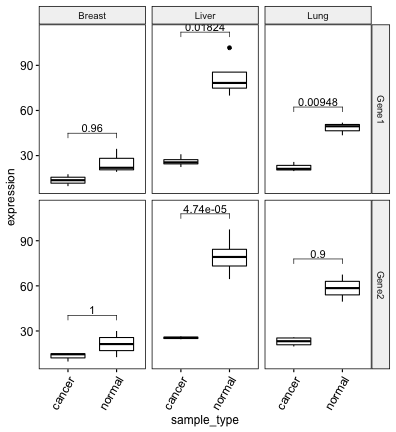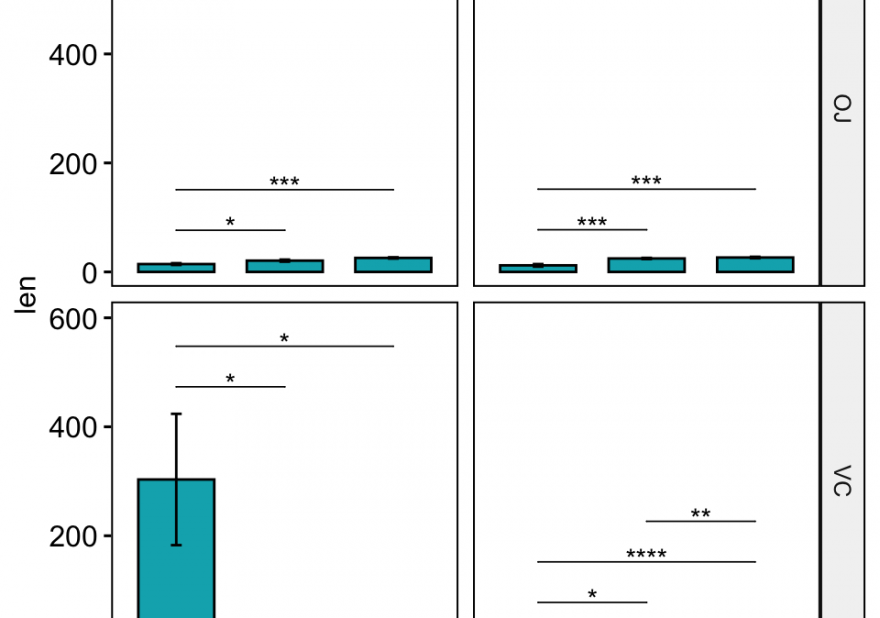
This article describes how to compute and automatically add p-values onto ggplot facets with different scales using the ggpubr...
This article describes how to compute and automatically add p-values onto ggplot facets with different scales using the ggpubr...