This article describes how to add p-values generated elsewhere to a ggplot using the ggpubr package. The following key ggpubr functions will be used:
stat_pvalue_manual(): Add manually p-values to a ggplot, such as box blots, dot plots and stripcharts.geom_bracket(): Add brackets with label annotation to a ggplot. Helpers for adding p-value or significance levels to a plot.
You will learn how to:
- Add custom p-values created from elsewhere
- Add p-values obtained from the rstatix R package
- Add brackets with custom p-value labels to a ggplot
Contents:
Prerequisites
Make sure you have the following R packages:
tidyversefor data manipulation and visualizationggpubrfor creating easily publication ready plotsrstatixprovides pipe-friendly R functions for easy statistical analyses
Load required R packages:
library(tidyverse)
library(ggpubr)
library(rstatix)
Data preparation
# Convert `dose` variable into factor
df <- ToothGrowth
df$dose <- factor(df$dose)

# Inspect the data
# Display two random rows by groups
set.seed(123)
df %>% sample_n_by(dose, size = 2)
## # A tibble: 6 x 3
## len supp dose
## <dbl> <fct> <fct>
## 1 10 VC 0.5
## 2 14.5 OJ 0.5
## 3 18.8 VC 1
## 4 25.8 OJ 1
## 5 29.4 OJ 2
## 6 23.6 VC 2Add p-values computed from elsewhere
Key R function: stat_pvalue_manual() [in ggpubr package]
stat_pvalue_manual(data, label = NULL)data: a data frame containing statistical test results. The expected default format should contain the following columns:group1 | group2 | p | y.position | etc.group1andgroup2are the groups that have been compared.pis the resulting p-value.y.positionis the y coordinates of the p-values in the plot.label: the column containing the label (e.g.:label = "p"orlabel = "p.adj"), where p is the p-value. Can be also an expression that can be formatted by thegluepackage. For example, when specifyinglabel = "t-test, p = {p}", the expression{p}will be replaced by its value.
# p-values
stat.test <- tibble::tribble(
  ~group1, ~group2,   ~p.adj,
    "0.5",     "1", 2.54e-07,
    "0.5",     "2", 1.32e-13,
      "1",     "2", 1.91e-05
  )
stat.test
## # A tibble: 3 x 3
## group1 group2 p.adj
## <chr> <chr> <dbl>
## 1 0.5 1 2.54e- 7
## 2 0.5 2 1.32e-13
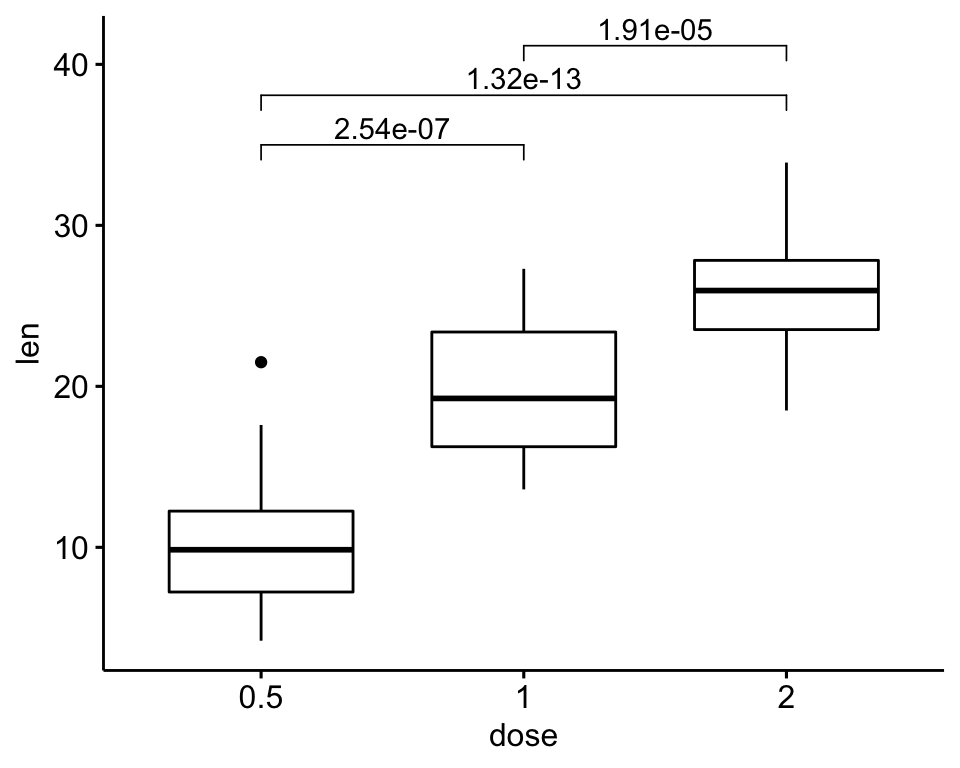
## 3 1 2 1.91e- 5# Box plots + p-values
ggboxplot(df, x = "dose", y = "len") +
stat_pvalue_manual(
stat.test,
y.position = 35, step.increase = 0.1,
label = "p.adj"
)
Add p-values obtained from the rstatix package
Create a simple box plot
bxp <- ggboxplot(df, x = "dose", y = "len")
bxp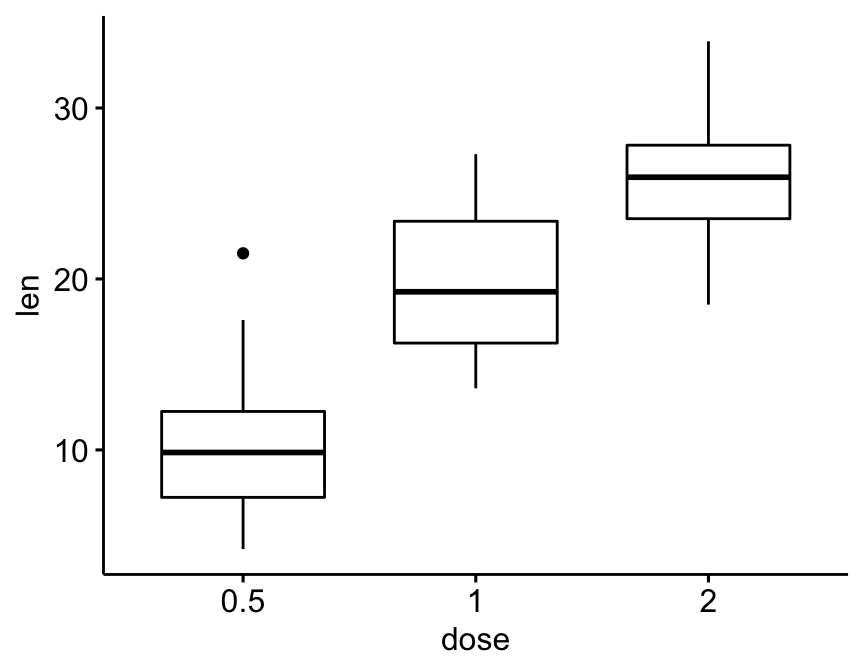
Pairwise comparisons
# Statistical test
stat.test <- df %>% t_test(len ~ dose)
stat.test
## # A tibble: 3 x 10
## .y. group1 group2 n1 n2 statistic df p p.adj p.adj.signif
## * <chr> <chr> <chr> <int> <int> <dbl> <dbl> <dbl> <dbl> <chr>
## 1 len 0.5 1 20 20 -6.48 38.0 1.27e- 7 2.54e- 7 ****
## 2 len 0.5 2 20 20 -11.8 36.9 4.40e-14 1.32e-13 ****
## 3 len 1 2 20 20 -4.90 37.1 1.91e- 5 1.91e- 5 ****# Box plot
stat.test <- stat.test %>% add_xy_position(x = "dose")
bxp + stat_pvalue_manual(stat.test, label = "p.adj.signif", tip.length = 0.01)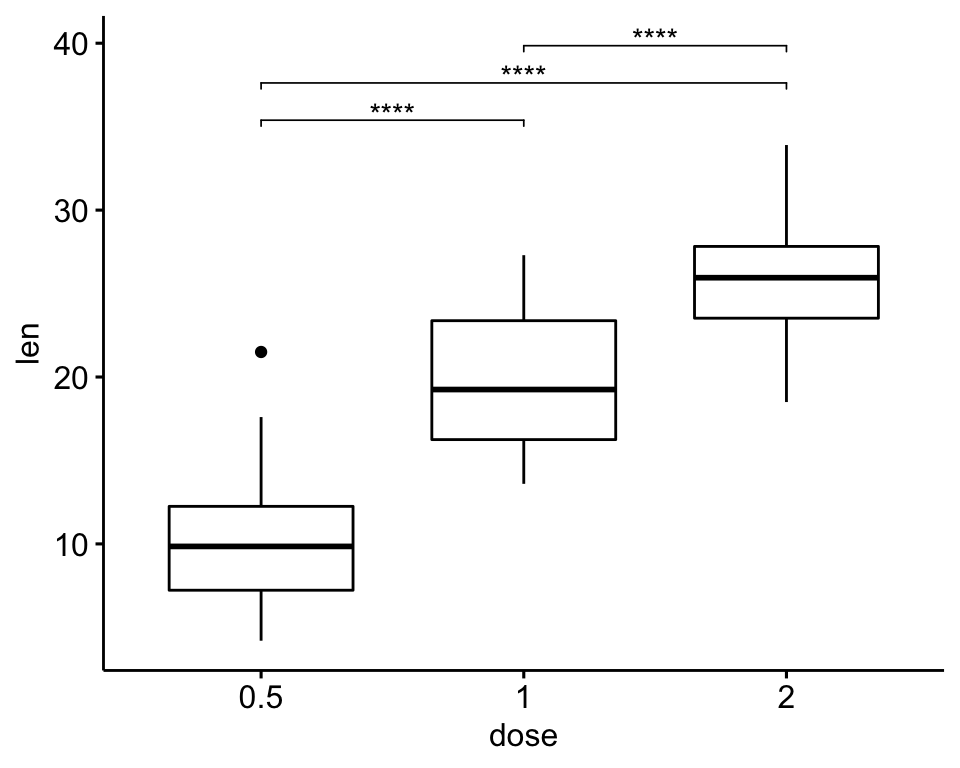
Faceted plots
# Statistical tests
stat.test <- df %>%
  group_by(supp) %>%
  t_test(len ~ dose, ref.group = "0.5")
stat.test
## # A tibble: 4 x 11
## supp .y. group1 group2 n1 n2 statistic df p p.adj p.adj.signif
## * <fct> <chr> <chr> <chr> <int> <int> <dbl> <dbl> <dbl> <dbl> <chr>
## 1 OJ len 0.5 1 10 10 -5.05 17.7 0.0000878 0.0000878 ****
## 2 OJ len 0.5 2 10 10 -7.82 14.7 0.00000132 0.00000264 ****
## 3 VC len 0.5 1 10 10 -7.46 17.9 0.000000681 0.000000681 ****
## 4 VC len 0.5 2 10 10 -10.4 14.3 0.0000000468 0.0000000936 ****# Box plots
stat.test <- stat.test %>% add_xy_position(x = "dose")
ggboxplot(df, x = "dose", y = "len", facet.by = "supp") +
stat_pvalue_manual(stat.test, label = "p.adj.signif", tip.length = 0.01)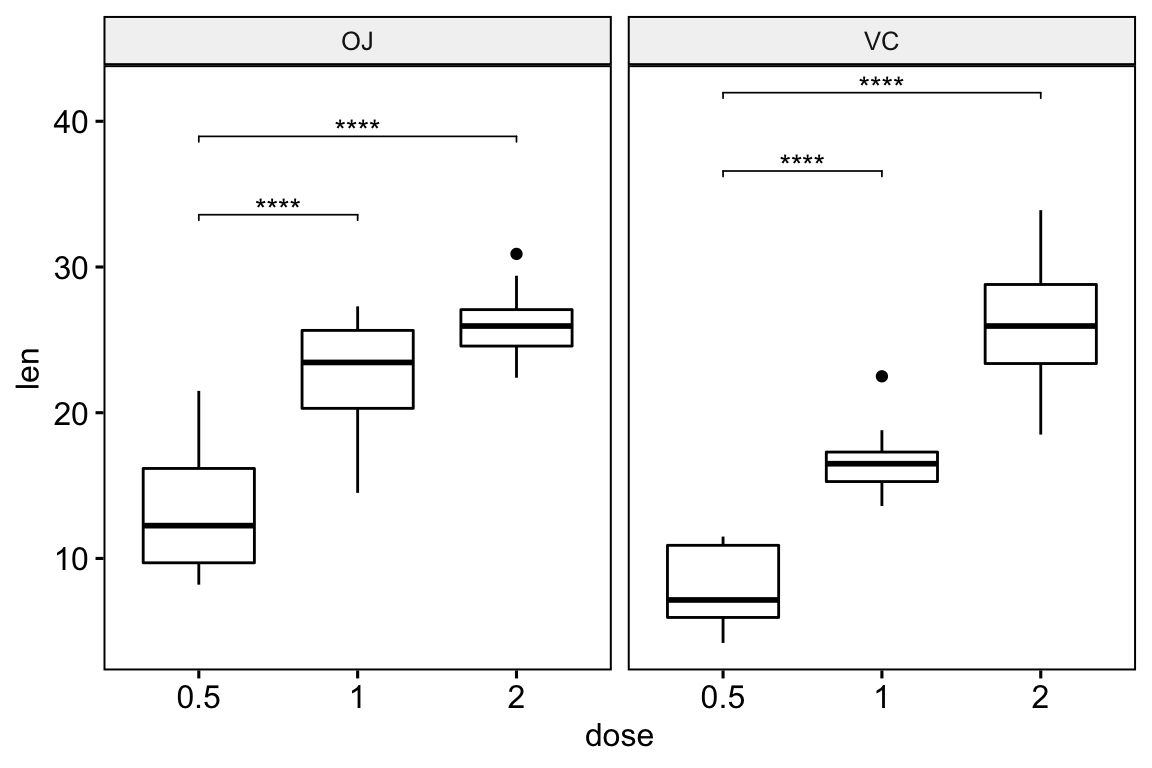
Grouped plots
# Box plot: comparison against reference
stat.test <- df %>%
  group_by(supp) %>%
  t_test(len ~ dose, ref.group = "0.5")

# Box plots
stat.test <- stat.test %>%
  add_xy_position(x = "supp", dodge = 0.8)
bxp <- ggboxplot(df, x = "supp", y = "len", color = "dose")
bxp + stat_pvalue_manual(stat.test,   label = "p.adj", tip.length = 0.01)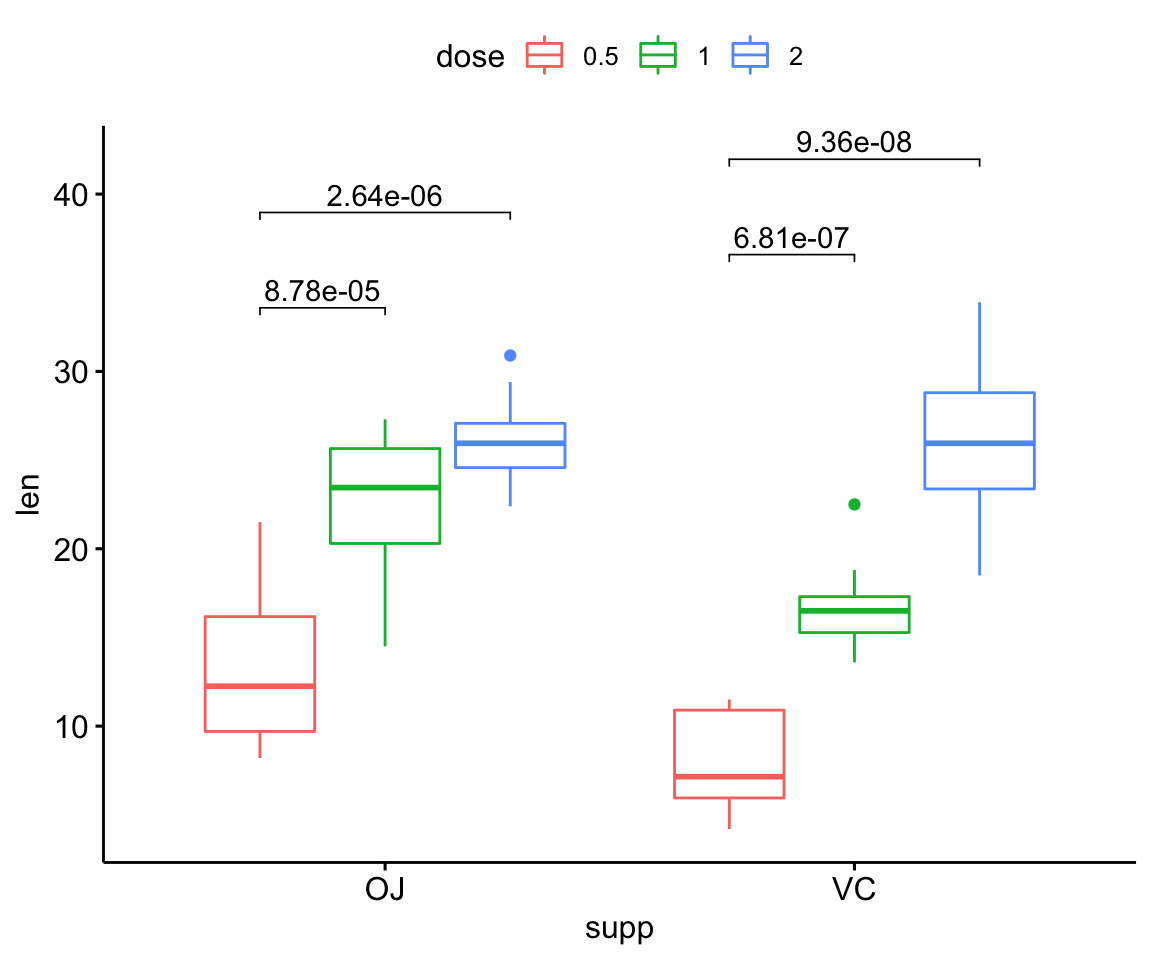
Specify manually the y position of the p-values
Create a simple box plot:
# Pairwise t-test between groups
stat.test <- ToothGrowth %>%
  t_test(len ~ dose) %>%
  mutate(y.position = c(29, 35, 39))
stat.test
## # A tibble: 3 x 11
## .y. group1 group2 n1 n2 statistic df p p.adj p.adj.signif y.position
## * <chr> <chr> <chr> <int> <int> <dbl> <dbl> <dbl> <dbl> <chr> <dbl>
## 1 len 0.5 1 20 20 -6.48 38.0 1.27e- 7 2.54e- 7 **** 29
## 2 len 0.5 2 20 20 -11.8 36.9 4.40e-14 1.32e-13 **** 35
## 3 len 1 2 20 20 -4.90 37.1 1.91e- 5 1.91e- 5 **** 39# Create a box plot and add the p-value
ggboxplot(ToothGrowth, x = "dose", y = "len") +
stat_pvalue_manual(stat.test, label = "p.adj")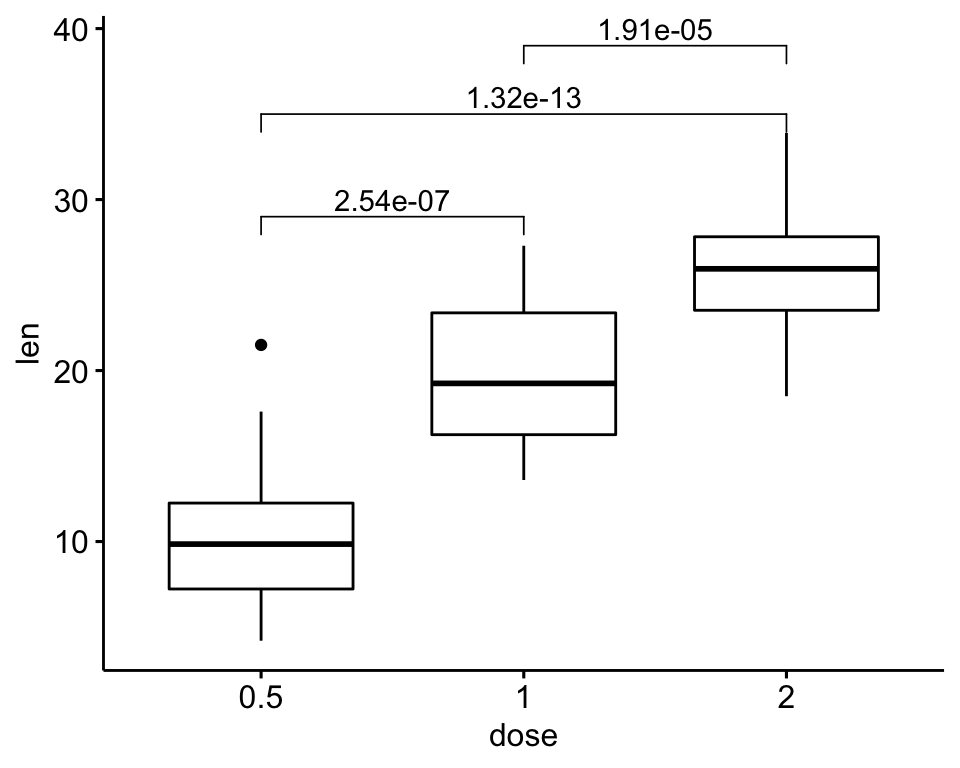
Faceted plots: Comparisons between two groups
# Pairwise t-test between groups
stat.test <- df %>%
  group_by(dose) %>%
  t_test(len ~ supp) %>%
  adjust_pvalue() %>%
  mutate(y.position = 35)
stat.test
## # A tibble: 3 x 11
## dose .y. group1 group2 n1 n2 statistic df p p.adj y.position
## * <fct> <chr> <chr> <chr> <int> <int> <dbl> <dbl> <dbl> <dbl> <dbl>
## 1 0.5 len OJ VC 10 10 3.17 15.0 0.00636 0.0127 35
## 2 1 len OJ VC 10 10 4.03 15.4 0.00104 0.00312 35
## 3 2 len OJ VC 10 10 -0.0461 14.0 0.964 0.964 35# Create a box plot and add the p-value
p <- ggboxplot(
df, x = "supp", y = "len",
color = "supp", palette = "jco",
facet.by = "dose", ylim = c(0, 40)
)
p + stat_pvalue_manual(stat.test, label = "p.adj")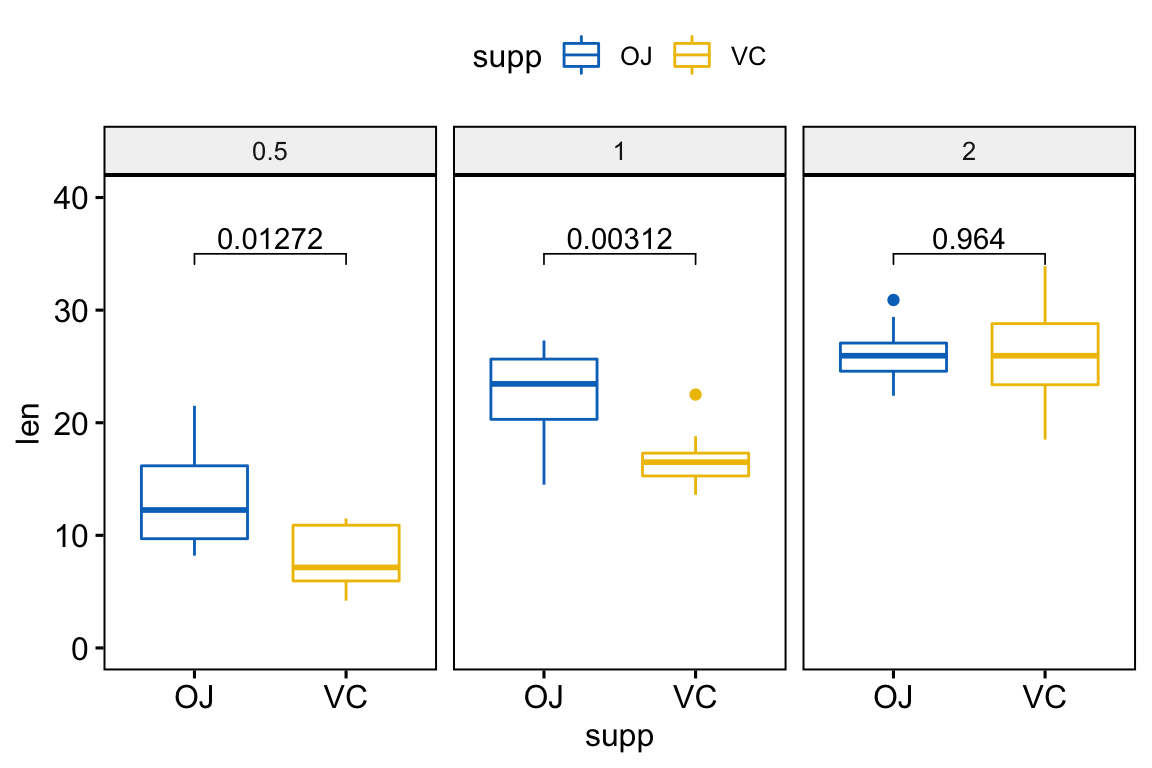
Faceted plots: Pairwise comparisons between multiple groups
# Pairwise t-test between groups
stat.test <- df %>%
  group_by(supp) %>%
  t_test(len ~ dose) %>%
  adjust_pvalue() %>%
  mutate(y.position = rep(c(29, 35, 39), 2))
stat.test
## # A tibble: 6 x 12
## supp .y. group1 group2 n1 n2 statistic df p p.adj p.adj.signif y.position
## * <fct> <chr> <chr> <chr> <int> <int> <dbl> <dbl> <dbl> <dbl> <chr> <dbl>
## 1 OJ len 0.5 1 10 10 -5.05 17.7 0.0000878 0.000263 *** 29
## 2 OJ len 0.5 2 10 10 -7.82 14.7 0.00000132 0.00000528 **** 35
## 3 OJ len 1 2 10 10 -2.25 15.8 0.039 0.039 * 39
## 4 VC len 0.5 1 10 10 -7.46 17.9 0.000000681 0.00000340 **** 29
## 5 VC len 0.5 2 10 10 -10.4 14.3 0.0000000468 0.000000281 **** 35
## 6 VC len 1 2 10 10 -5.47 13.6 0.0000916 0.000263 **** 39# Create a box plot and add the p-value
p <- ggboxplot(
df, x = "dose", y = "len",
color = "supp", palette = "jco",
facet.by = "supp", ylim = c(0, 40)
)
p + stat_pvalue_manual(stat.test)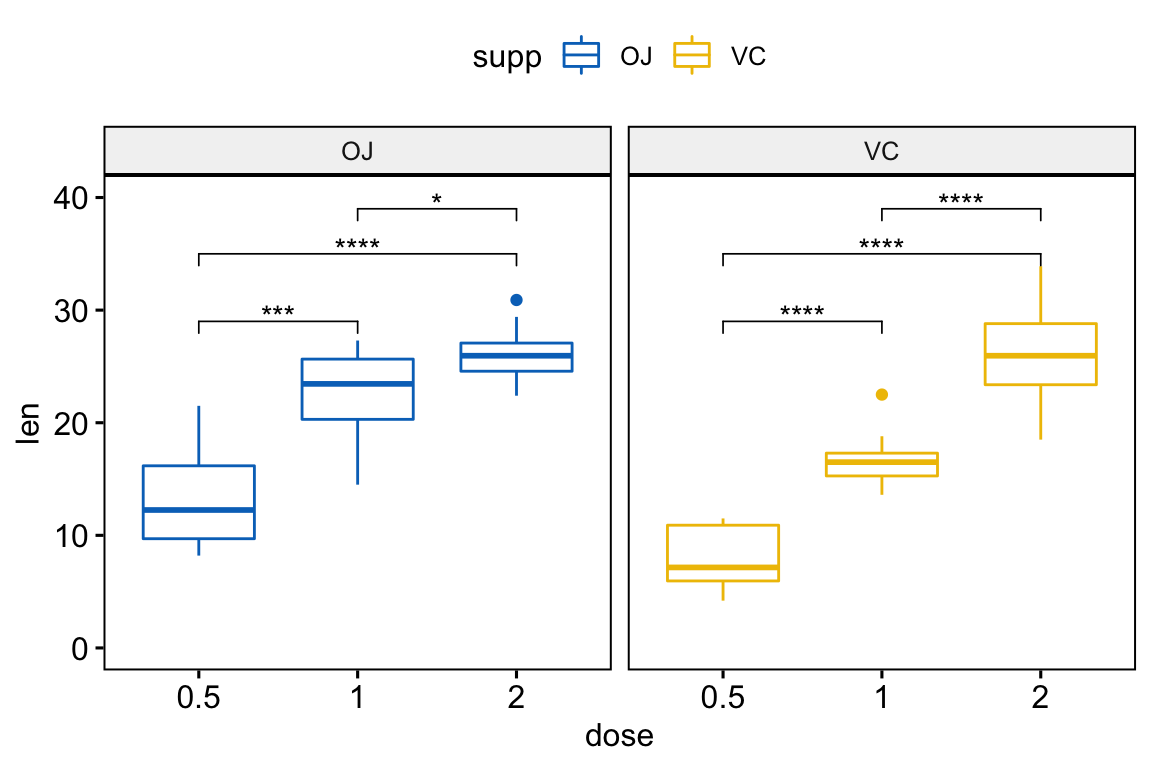
Grouped plots
# Pairwise t-test between groups
stat.test <- df %>%
  group_by(dose) %>%
  t_test(len ~ supp) %>%
  adjust_pvalue() %>%
  mutate(y.position = 35)
stat.test
## # A tibble: 3 x 11
## dose .y. group1 group2 n1 n2 statistic df p p.adj y.position
## * <fct> <chr> <chr> <chr> <int> <int> <dbl> <dbl> <dbl> <dbl> <dbl>
## 1 0.5 len OJ VC 10 10 3.17 15.0 0.00636 0.0127 35
## 2 1 len OJ VC 10 10 4.03 15.4 0.00104 0.00312 35
## 3 2 len OJ VC 10 10 -0.0461 14.0 0.964 0.964 35# Create a box plot and add the p-value
p <- ggboxplot(
ToothGrowth, x = "dose", y = "len",
color = "supp", palette = "jco",
ylim = c(0, 40)
)
p + stat_pvalue_manual(stat.test, xmin = "dose", xmax = NULL)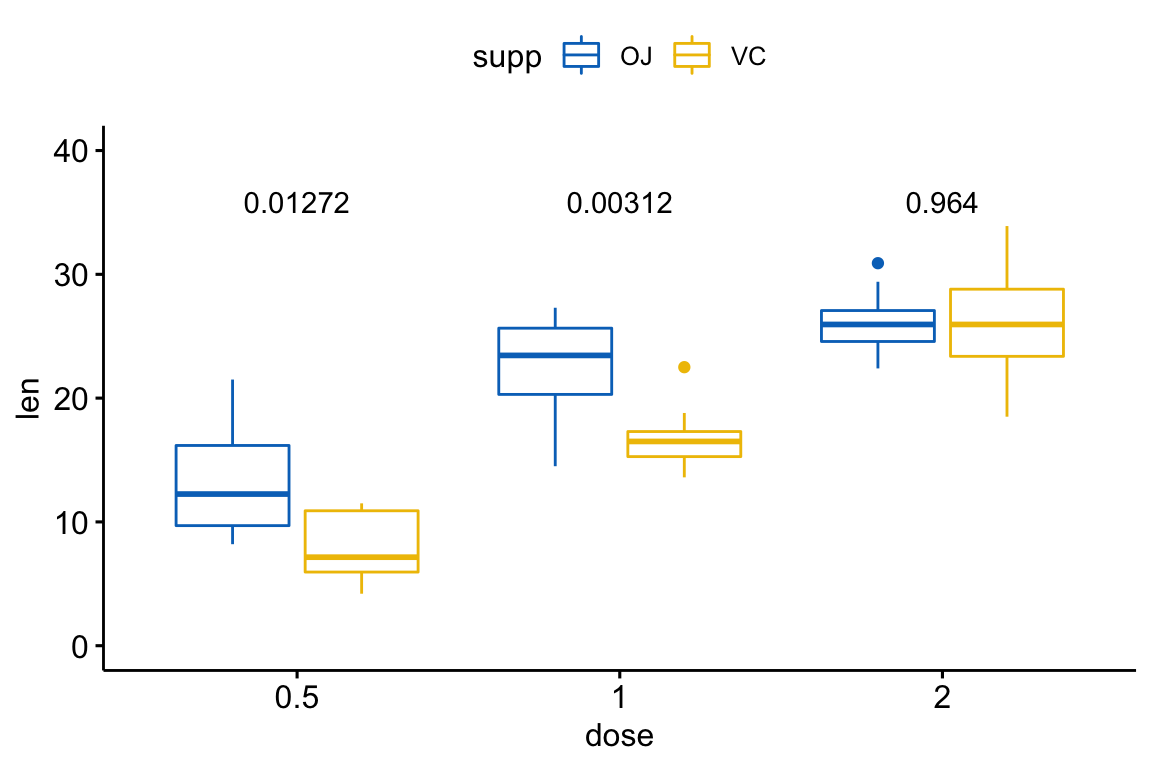
Add brackets with custom p-value labels to a ggplot
This section describes the function geom_bracket() [in ggpubr package] for adding brackets with label annotation to a ggplot. It makes it easy to add p-value or significance levels created elsewhere to a plot.
Basic brackets with labels
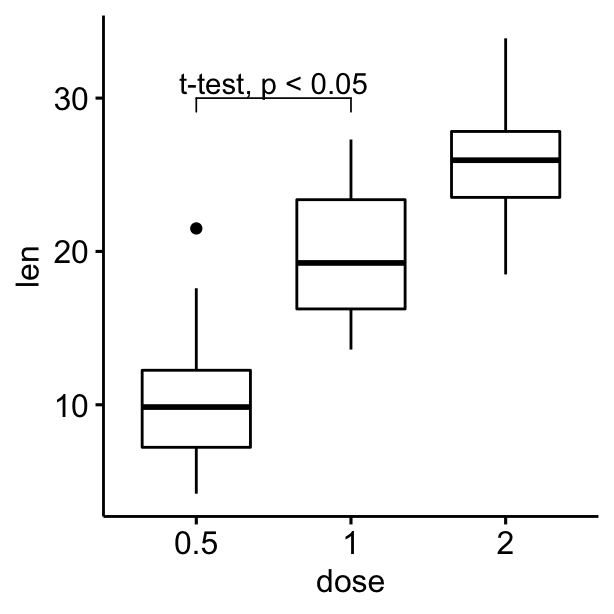
# Add bracket with labels
ggboxplot(df, x = "dose", y = "len") +
geom_bracket(
xmin = "0.5", xmax = "1", y.position = 30,
label = "t-test, p < 0.05"
)
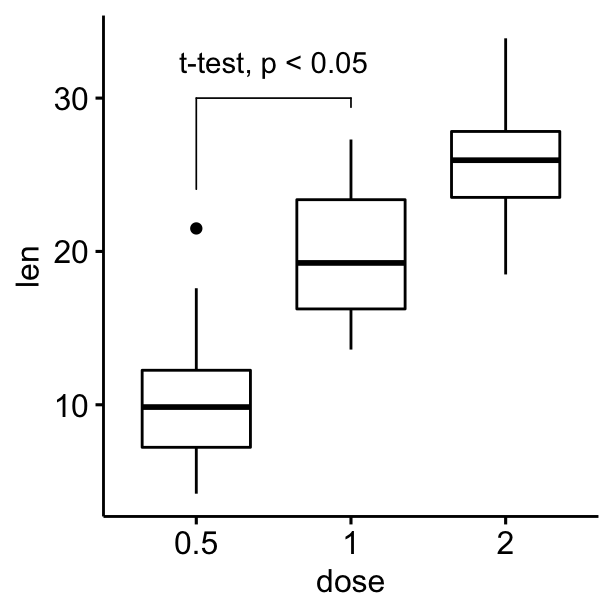
# Customize bracket tip.length tip.length
# Move up the label using vjust
ggboxplot(df, x = "dose", y = "len") +
geom_bracket(
xmin = "0.5", xmax = "1", y.position = 30,
label = "t-test, p < 0.05",
tip.length = c(0.2, 0.02), vjust = -1
)
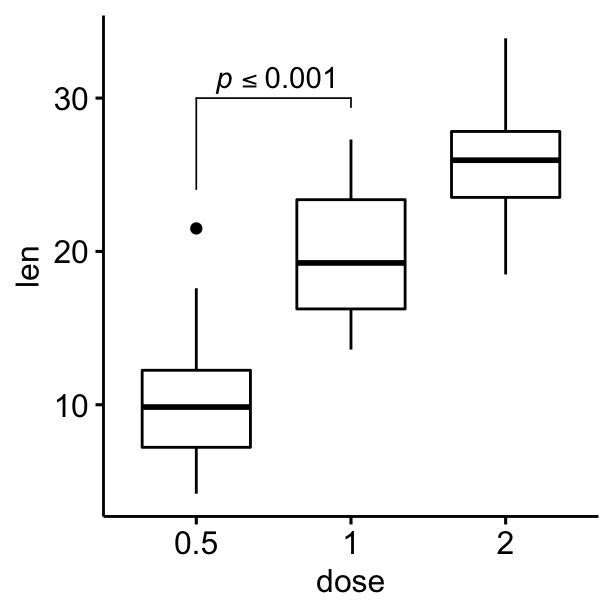
Using plotmath expression and specifying multiple brackets manually
#Using plotmath expression
ggboxplot(df, x = "dose", y = "len") +
geom_bracket(
xmin = "0.5", xmax = "1", y.position = 30,
label = "list(~italic(p)<=0.001)", type = "expression",
tip.length = c(0.2, 0.02)
)
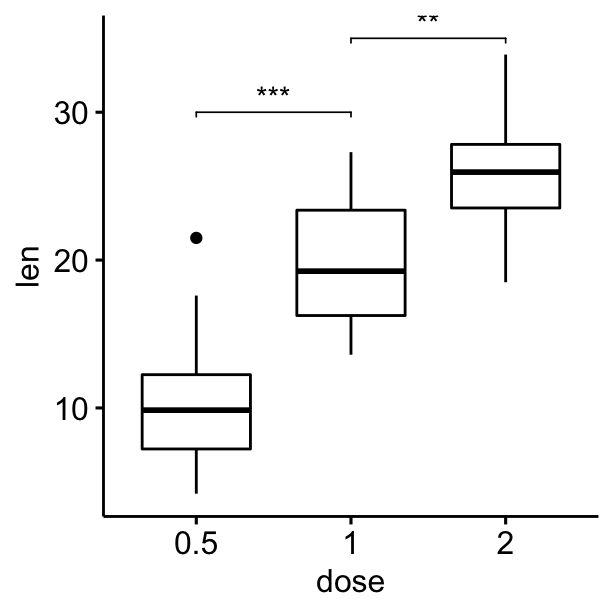
# Specify multiple brackets manually
ggboxplot(df, x = "dose", y = "len") +
geom_bracket(
xmin = c("0.5", "1"), xmax = c("1", "2"),
y.position = c(30, 35), label = c("***", "**"),
tip.length = 0.01
)
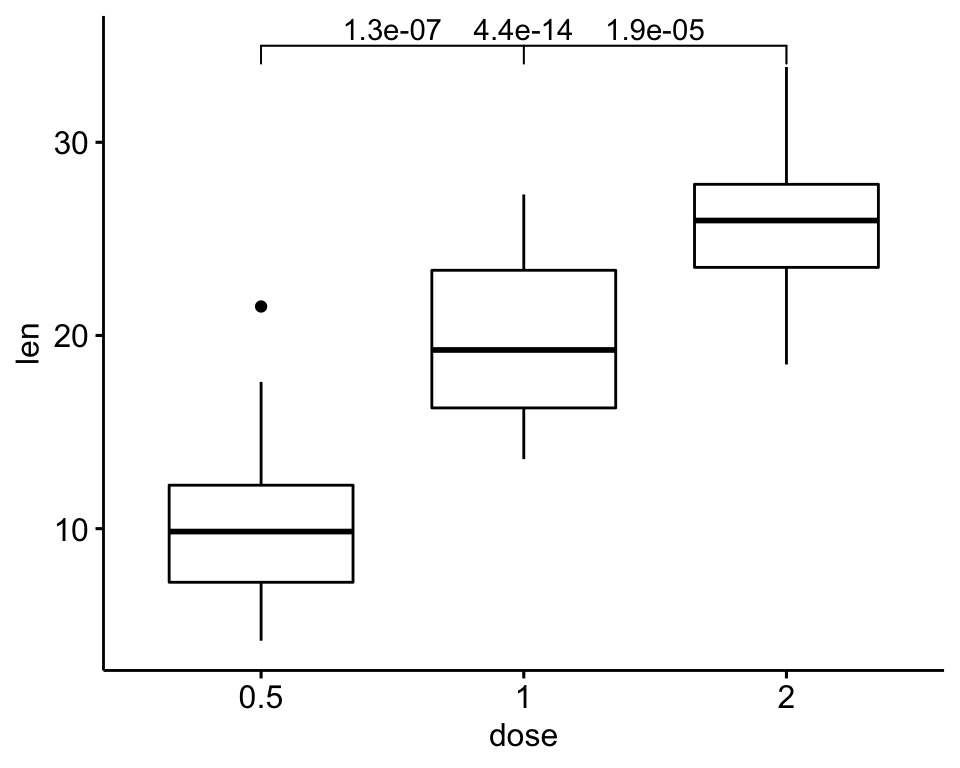
Compute statistical tests and add p-values
# Compute statistical tests and add p-values
stat.test <- compare_means(len ~ dose, ToothGrowth, method = "t.test")
ggboxplot(df, x = "dose", y = "len") +
  geom_bracket(
    aes(xmin = group1, xmax = group2, label = signif(p, 2)),
    data = stat.test, y.position = 35
  )
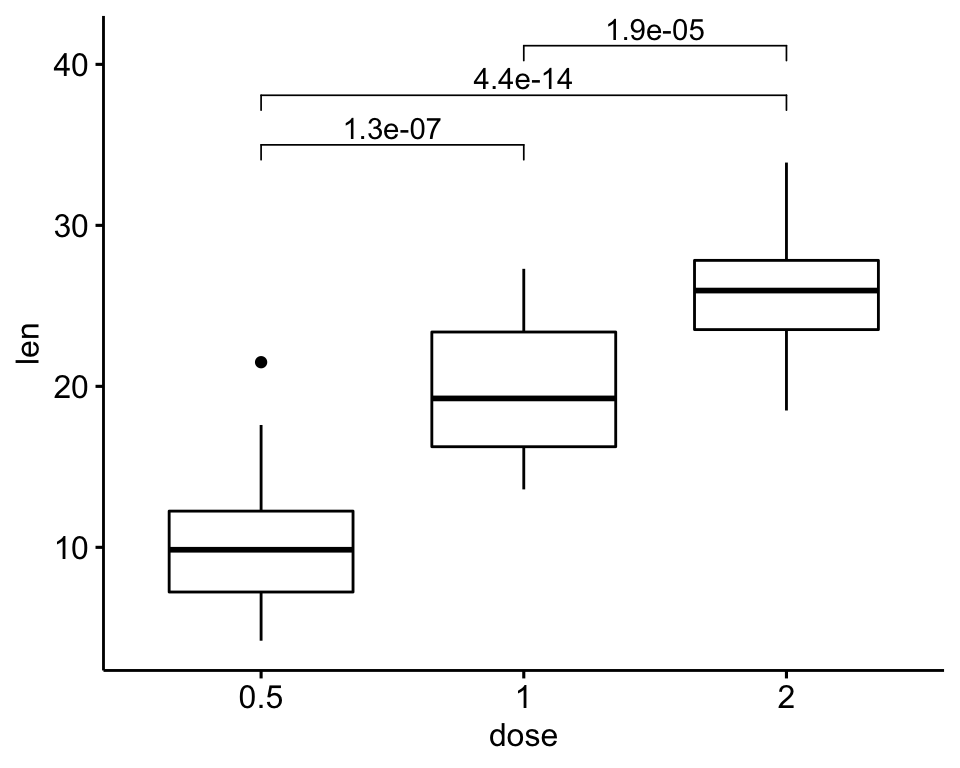
# Increase step length between brackets
ggboxplot(df, x = "dose", y = "len") +
  geom_bracket(
    aes(xmin = group1, xmax = group2, label = signif(p, 2)),
    data = stat.test, y.position = 35, step.increase = 0.1
  )
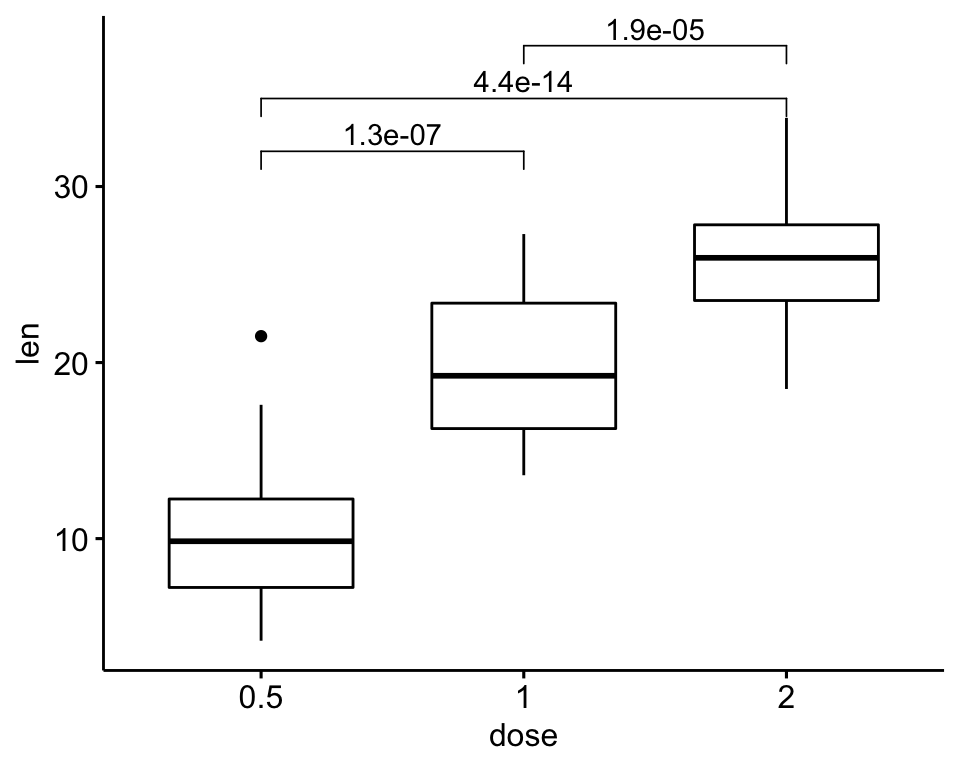
# Or specify the positions of each comparison
ggboxplot(df, x = "dose", y = "len") +
  geom_bracket(
    aes(xmin = group1, xmax = group2, label = signif(p, 2)),
    data = stat.test, y.position = c(32, 35, 38)
   )
Conclusions
This article describes how to add p-values generated elsewhere to a ggplot using the ggpubr package.
Recommended for you
This section contains best data science and self-development resources to help you on your path.
Books - Data Science
Our Books
- Practical Guide to Cluster Analysis in R by A. Kassambara (Datanovia)
- Practical Guide To Principal Component Methods in R by A. Kassambara (Datanovia)
- Machine Learning Essentials: Practical Guide in R by A. Kassambara (Datanovia)
- R Graphics Essentials for Great Data Visualization by A. Kassambara (Datanovia)
- GGPlot2 Essentials for Great Data Visualization in R by A. Kassambara (Datanovia)
- Network Analysis and Visualization in R by A. Kassambara (Datanovia)
- Practical Statistics in R for Comparing Groups: Numerical Variables by A. Kassambara (Datanovia)
- Inter-Rater Reliability Essentials: Practical Guide in R by A. Kassambara (Datanovia)
Others
- R for Data Science: Import, Tidy, Transform, Visualize, and Model Data by Hadley Wickham & Garrett Grolemund
- Hands-On Machine Learning with Scikit-Learn, Keras, and TensorFlow: Concepts, Tools, and Techniques to Build Intelligent Systems by Aurelien Géron
- Practical Statistics for Data Scientists: 50 Essential Concepts by Peter Bruce & Andrew Bruce
- Hands-On Programming with R: Write Your Own Functions And Simulations by Garrett Grolemund & Hadley Wickham
- An Introduction to Statistical Learning: with Applications in R by Gareth James et al.
- Deep Learning with R by François Chollet & J.J. Allaire
- Deep Learning with Python by François Chollet
Version:
 Français


Hello Kassambara,
Many thanks for your tutorial. It’s very helpful.
In the document, “step.increase” argument means numeric vector with the increase in fraction of total height for every additional comparison to minimize overlap; and “tip.length” means numeric vector with the fraction of total height that the bar goes down to indicate the precise column.
I was wondering, what is the “total height” in these two arguments’ definition? Could you please explain more about it?
Many thanks for your help!
Thank you Xiaochi Liu for your positive feedback. The total height corresponds to the y-axis scale range (ymax-ymin)
What would it be the numbers on the function “mutate(y.position = rep(c…”?
Dear Kassambara,
Great tutorial, thanks for sharing!
I’d like to use stat_pvalue_manual() to include emmeans posthoc tests to my analysis. However, it doesn’t work the same way you described because emmeans produces a emmGrid as a result, and not a table like the t-test() here.
I noticed that there is a function that is based on rstatix called emmeans_test. This one produces a table so I guess it could be used instead of emmeans. How similar would emmeans and emmeans_test be? And do you know by any chance why I get the following error message when I try to run emmeans_test?
> df %>% emmeans_test(len ~ dose, p.adjust.method = “bonferroni”)
Error: Column name `std.error` must not be duplicated.
Use .name_repair to specify repair.
Many thanks!! Cheers, Gustavo
Did you have any answer to this post, please?
Hi Gustavo, have you ever worked out a solution? I am trying to do the same