
In this article, you will learn how to map variables in the data to visual properpeties of ggplot geoms (points, bars, box plot, etc).
These visual caracteristics are known as aesthetics (or aes) and include:
- color and fill
- points shape
- line type
- size
- group
- etc
Aesthetic mappings can be defined in ggplot() and in individual layers (such as geom_point(), geom_line(), etc).
Contents:
Related Book
GGPlot2 Essentials for Great Data Visualization in RPrerequisites
Load required packages and set the theme function theme_bw() as the default theme:
library(ggplot2)
theme_set(theme_bw())
Basics
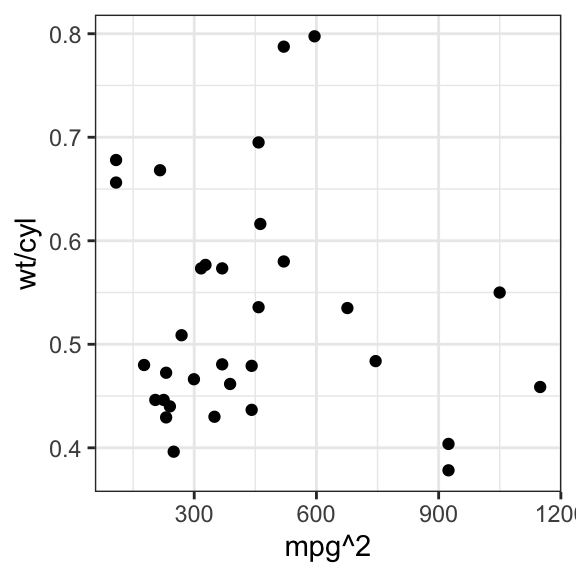
Map aesthetics to variables and to functions of variables:
# Map aesthetics to variables
ggplot(ToothGrowth, aes(x = supp, y = len)) +
  geom_boxplot()

# Map aesthetics to functions of variables
ggplot(mtcars, aes(x = mpg ^ 2, y = wt / cyl)) +
  geom_point()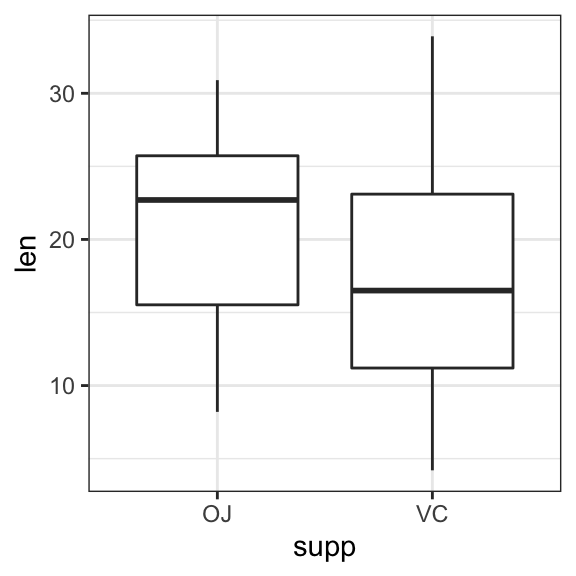
Aesthetics can be also mapped to constants:
# map x to constant: 1
ggplot(ToothGrowth, aes(x = factor(1), y = len)) +
  geom_boxplot(width = 0.5) +
  geom_jitter(width = 0.1)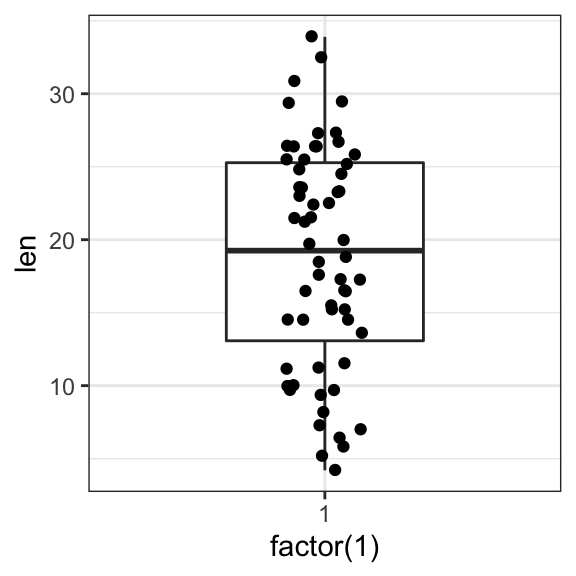
Note that, aes() is passed to either ggplot() or to specific layer. Aesthetics specified to ggplot() are used as defaults for every layer.
For example:
# Use this
ggplot(mpg, aes(displ, hwy)) + geom_point()

# or this
ggplot(mpg) + geom_point(aes(displ, hwy))
Color and fill
# Color
ggplot(ToothGrowth, aes(supp, len)) +
geom_boxplot(aes(color = supp))
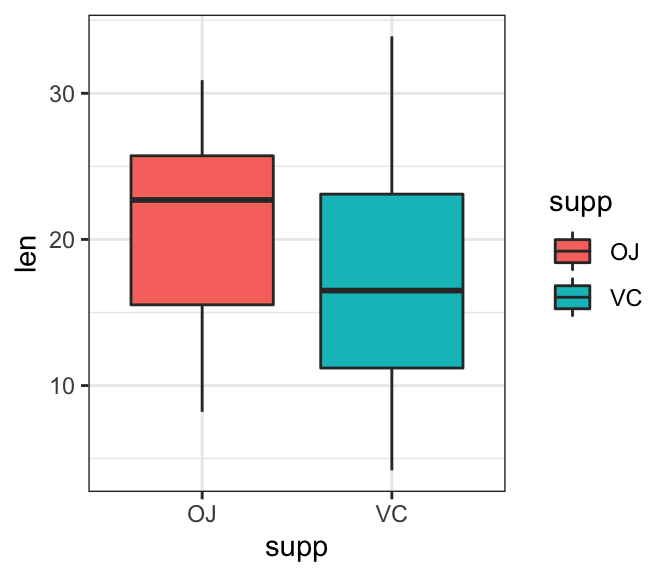
# Fill
ggplot(ToothGrowth, aes(supp, len)) +
geom_boxplot(aes(fill = supp))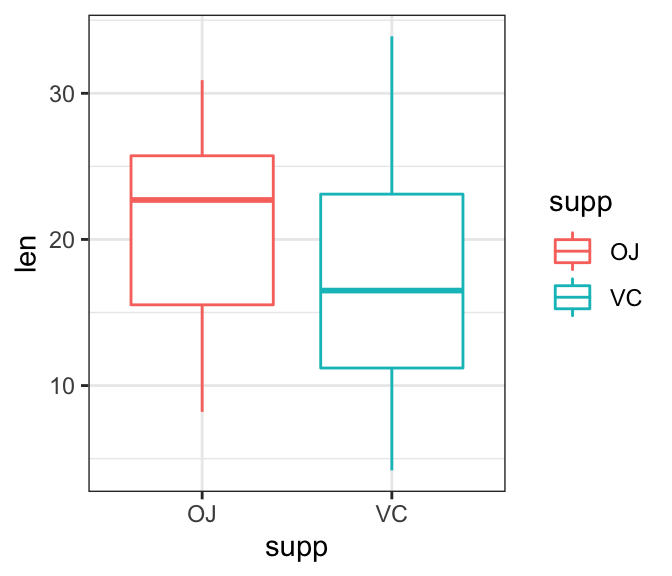
Shape
Change point shapes by groups:
ggplot(iris, aes(Sepal.Length, Sepal.Width)) +
  geom_point(aes(shape = Species))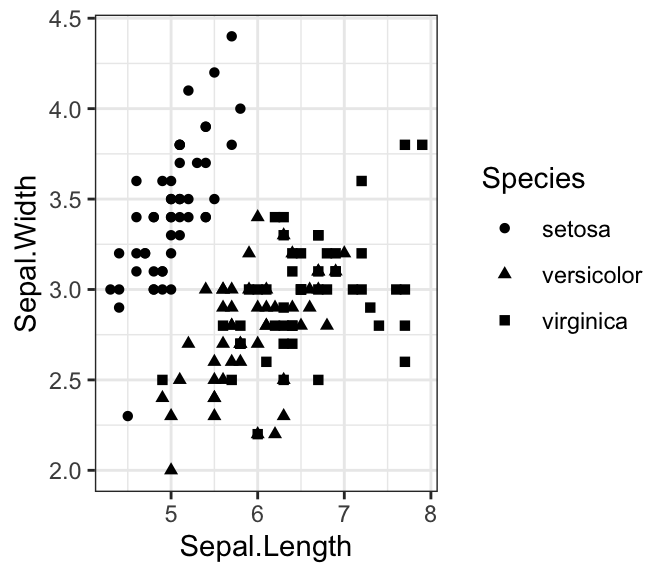
Group and line type
In line plot, for example, group aesthetic is used to ensure lines are drawn separately for each group
# Data
df2 <- data.frame(supp=rep(c("VC", "OJ"), each=3),
                dose=rep(c("D0.5", "D1", "D2"),2),
                len=c(6.8, 15, 33, 4.2, 10, 29.5))

head(df2, 4)
## supp dose len
## 1 VC D0.5 6.8
## 2 VC D1 15.0
## 3 VC D2 33.0
## 4 OJ D0.5 4.2# Create a grouped line plot
ggplot(df2, aes(dose, len, group = supp)) +
geom_line() +
geom_point()
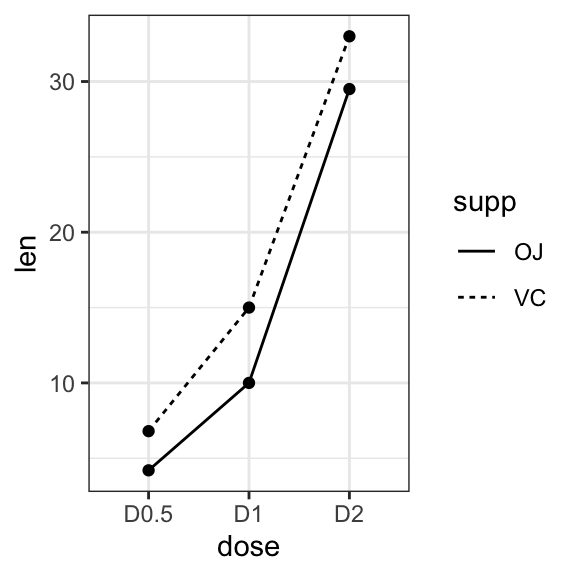
# Change linetype by groups
ggplot(df2, aes(dose, len, group = supp)) +
geom_line(aes(linetype = supp)) +
geom_point()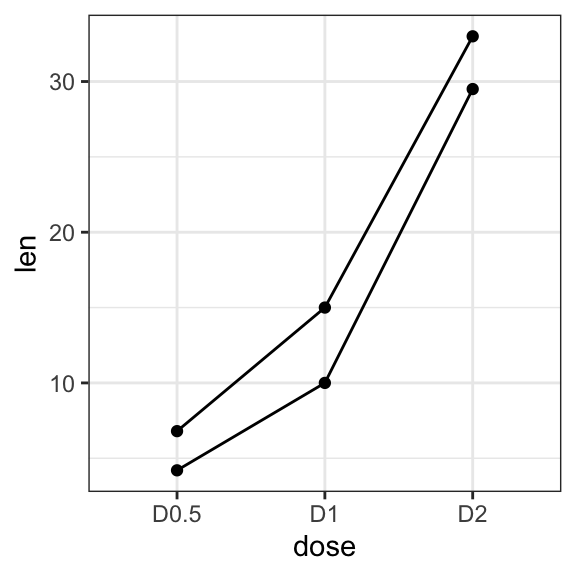
Label
ggplot(df2, aes(dose, len, group = supp)) +
  geom_line() +
  geom_point() +
  geom_text(aes(label = len, vjust = -0.5))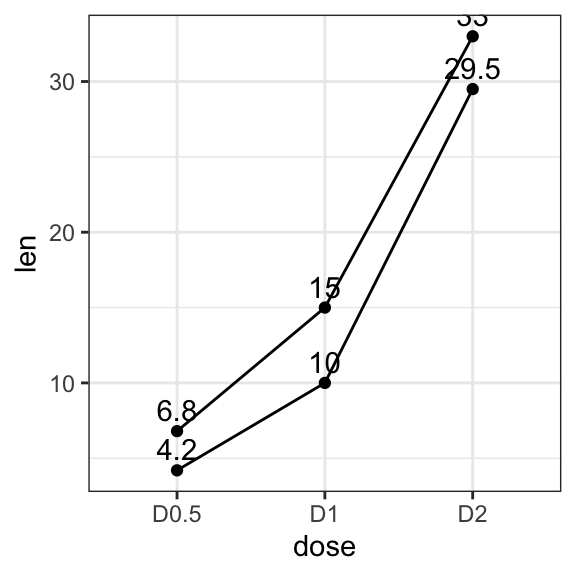
Create wrappers around ggplot2 pipelines
aes() automatically quotes all its arguments, so you need to use tidy-evaluation to create wrappers around ggplot2 pipelines.
- Simplest case: your wrapper takes dots
scatter_plot <- function(data, ...) {
  ggplot(data) + geom_point(aes(...))
}
scatter_plot(mtcars, disp, drat)
- Your wrapper has named arguments. You need “enquote and unquote”
scatter_plot <- function(data, x, y) {
  x <- enquo(x)
  y <- enquo(y)

  ggplot(data) + geom_point(aes(!!x, !!y))
}
scatter_plot(mtcars, disp, drat)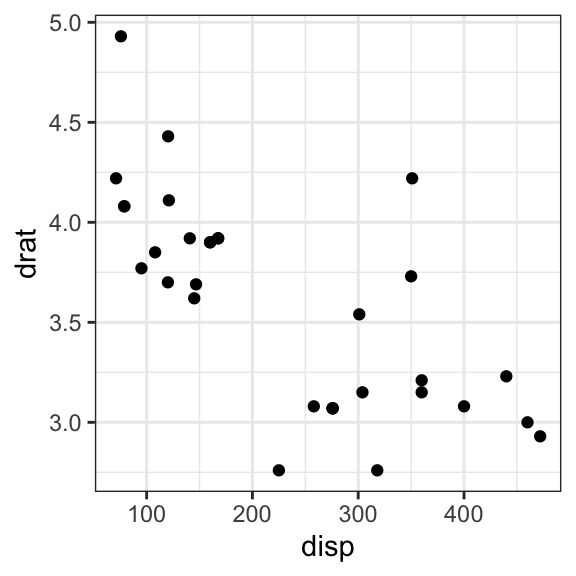
Note that, users of your wrapper can use their own functions in the quoted expressions.
cut3 <- function(x) cut_number(x, 3)
scatter_plot(mtcars, cut3(disp), drat)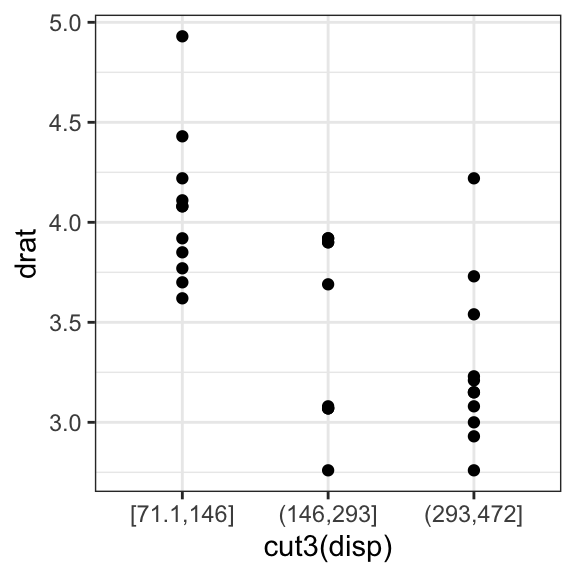
Recommended for you
This section contains best data science and self-development resources to help you on your path.
Books - Data Science
Our Books
- Practical Guide to Cluster Analysis in R by A. Kassambara (Datanovia)
- Practical Guide To Principal Component Methods in R by A. Kassambara (Datanovia)
- Machine Learning Essentials: Practical Guide in R by A. Kassambara (Datanovia)
- R Graphics Essentials for Great Data Visualization by A. Kassambara (Datanovia)
- GGPlot2 Essentials for Great Data Visualization in R by A. Kassambara (Datanovia)
- Network Analysis and Visualization in R by A. Kassambara (Datanovia)
- Practical Statistics in R for Comparing Groups: Numerical Variables by A. Kassambara (Datanovia)
- Inter-Rater Reliability Essentials: Practical Guide in R by A. Kassambara (Datanovia)
Others
- R for Data Science: Import, Tidy, Transform, Visualize, and Model Data by Hadley Wickham & Garrett Grolemund
- Hands-On Machine Learning with Scikit-Learn, Keras, and TensorFlow: Concepts, Tools, and Techniques to Build Intelligent Systems by Aurelien Géron
- Practical Statistics for Data Scientists: 50 Essential Concepts by Peter Bruce & Andrew Bruce
- Hands-On Programming with R: Write Your Own Functions And Simulations by Garrett Grolemund & Hadley Wickham
- An Introduction to Statistical Learning: with Applications in R by Gareth James et al.
- Deep Learning with R by François Chollet & J.J. Allaire
- Deep Learning with Python by François Chollet
Version:
 Français


No Comments