
This article describes how to change easily ggplot facet labels.
Contents:
Related Book
GGPlot2 Essentials for Great Data Visualization in RPrerequisites
Load required packages and set the theme function theme_light() [ggplot2] as the default theme:
library(ggplot2)
theme_set(
  theme_light() + theme(legend.position = "top")
  )
Basic ggplot with facet
Create a box plot filled by groups:
# Load data and convert dose to a factor variable
data("ToothGrowth")
ToothGrowth$dose <- as.factor(ToothGrowth$dose)

# Box plot, facet accordding to the variable dose and supp
p <- ggplot(ToothGrowth, aes(x = dose, y = len)) +
  geom_boxplot(aes(fill = supp), position = position_dodge(0.9)) +
  scale_fill_viridis_d()
p + facet_grid(dose ~ supp)
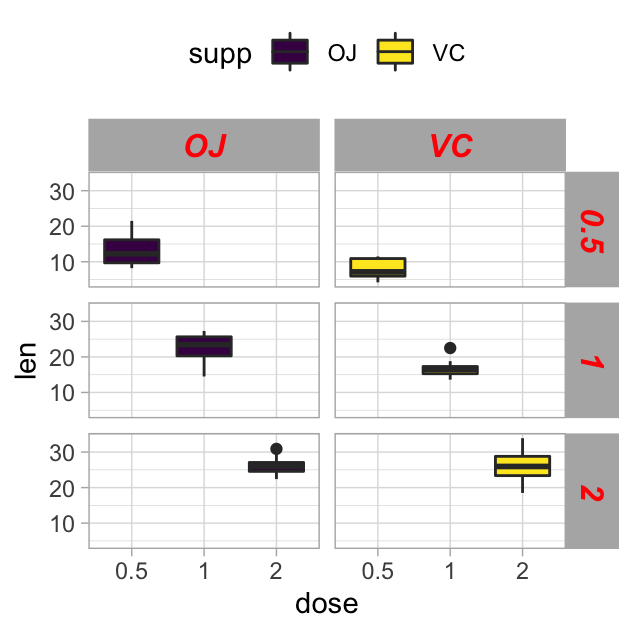
Change the text of facet labels
Facet labels can be modified using the option labeller, which should be a function.
- In the following R code, facets are labelled by combining the name of the grouping variable with group levels. The labeller function
label_bothis used.
p + facet_grid(dose ~ supp, labeller = label_both)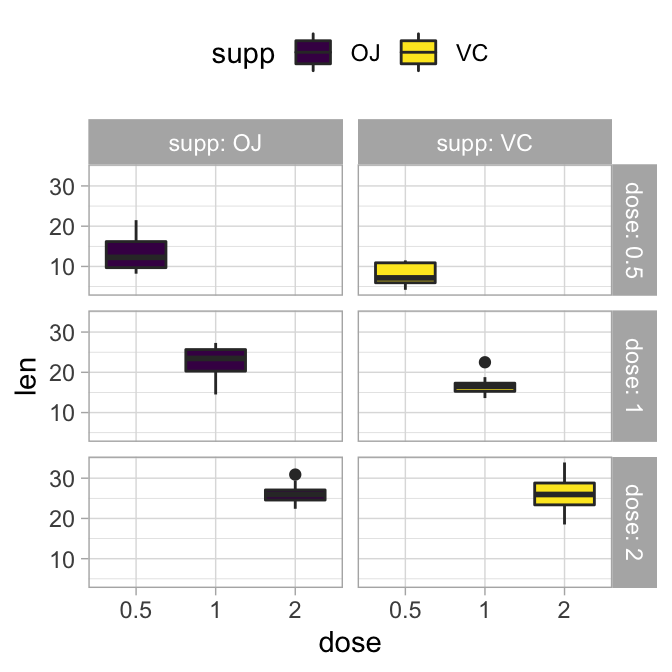
- A simple way to modify facet label text, is to provide new labels as a named character vector:
# New facet label names for dose variable
dose.labs <- c("D0.5", "D1", "D2")
names(dose.labs) <- c("0.5", "1", "2")

# New facet label names for supp variable
supp.labs <- c("Orange Juice", "Vitamin C")
names(supp.labs) <- c("OJ", "VC")

# Create the plot
p + facet_grid(
  dose ~ supp,
  labeller = labeller(dose = dose.labs, supp = supp.labs)
  )
- An alternative solution to change the facet labels, is to modify the data:
df <- ToothGrowth
# Modify the data
df$dose <- factor(df$dose, levels = c("0.5", "1", "2"),
                  labels = c("D0.5", "D1", "D2"))
df$supp <- factor(df$supp, levels = c("OJ", "VC"),
                  labels = c("Orange Juice", "Vitamin C")
                  )
# Create the plot
ggplot(df, aes(x = dose, y = len)) +
  geom_boxplot(aes(fill = supp)) +
  facet_grid(dose ~ supp)
Customize facet labels appearance
# Change facet text font. Possible values for the font style:
  #'plain', 'italic', 'bold', 'bold.italic'.
p + facet_grid(dose ~ supp)+
    theme(
      strip.text.x = element_text(
        size = 12, color = "red", face = "bold.italic"
        ),
      strip.text.y = element_text(
        size = 12, color = "red", face = "bold.italic"
        )
      )
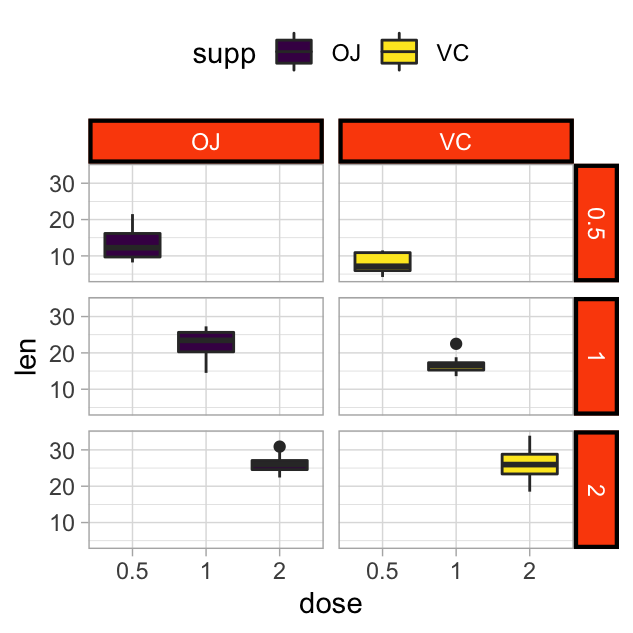
Change facet background color
The rectangle around facet labels can be modified using the function element_rect().
p + facet_grid(dose ~ supp)+
 theme(
   strip.background = element_rect(
     color="black", fill="#FC4E07", size=1.5, linetype="solid"
     )
   )
Recommended for you
This section contains best data science and self-development resources to help you on your path.
Books - Data Science
Our Books
- Practical Guide to Cluster Analysis in R by A. Kassambara (Datanovia)
- Practical Guide To Principal Component Methods in R by A. Kassambara (Datanovia)
- Machine Learning Essentials: Practical Guide in R by A. Kassambara (Datanovia)
- R Graphics Essentials for Great Data Visualization by A. Kassambara (Datanovia)
- GGPlot2 Essentials for Great Data Visualization in R by A. Kassambara (Datanovia)
- Network Analysis and Visualization in R by A. Kassambara (Datanovia)
- Practical Statistics in R for Comparing Groups: Numerical Variables by A. Kassambara (Datanovia)
- Inter-Rater Reliability Essentials: Practical Guide in R by A. Kassambara (Datanovia)
Others
- R for Data Science: Import, Tidy, Transform, Visualize, and Model Data by Hadley Wickham & Garrett Grolemund
- Hands-On Machine Learning with Scikit-Learn, Keras, and TensorFlow: Concepts, Tools, and Techniques to Build Intelligent Systems by Aurelien Géron
- Practical Statistics for Data Scientists: 50 Essential Concepts by Peter Bruce & Andrew Bruce
- Hands-On Programming with R: Write Your Own Functions And Simulations by Garrett Grolemund & Hadley Wickham
- An Introduction to Statistical Learning: with Applications in R by Gareth James et al.
- Deep Learning with R by François Chollet & J.J. Allaire
- Deep Learning with Python by François Chollet
Version:
 Français


Another great and very useful post,
(with clear code examples).
Thanks you again, Kassambara.
You are a Pro!.
SFer
San Francisco
Thank you SFer for your feedback, always appreciated!
Thanks for these information!
On top of what you describe here: How can I change the font of only once facet and leave the others untouched?
Say have one facet label in italic and the others in plain?
Hi,
I don’t know how to modify the font of only one panel. If you find any solution, I would appreciate if you can share it.
This is a great tutorial – thanks!
Can you provide some examples of how to change the legend elements (title, names) – the usual way doesn’t seem to work.
I have a facet wrap of 30 plots; I want to increase the margin between the axis title and the plot and also each plot to have its own custom y-axis range. I have tried a bunch of options but they ain’t working. I would appreciate your help.
Such a helpful and useful post with clear examples of each step. Thank you! from newbie in R
Thank you for your positive feedback!
Dear Kassambara,
Thank you for the excellent statistics lesson and data presentation. The best tutorial I’ve ever seen !!!
I have a question, is it possible to introduce special characters (e.g. superscript / subscript) to panel labels?
Hi ArkSta, thank you for the positive feedback, highly appreciated!
You want
labeller = label_parsed. Here’s a simple exampleThank you very much for your time and quick reply.
I have a slightly different problem because I built ggbarpolt based on the ggpubr package and then split them into panels based on the formula facet.by = “xyz”
In this case, is it possible to introduce special characters to the panel labels?
In the current version, ggpubr doesn’t support the argument labeller = “label_parsed”, so you can go as follow:
Dear Professor!
Works perfectly !!!
Again thank you very much 🙂
Best regards,
Arek
Thank you! This was a huge assist!!
Hi Kassambara.
Is there a way to remove the facet plot titles completely?
Thanks.
To remove the facet labels completely, you can use something similar to the following R code:
Thank you, these examples are a good amendment to the documentation.
One quick comment: Instead of
“`r
dose.labs <- c("D0.5", "D1", "D2")
names(dose.labs) <- c("0.5", "1", "2")
“`
it is easier to write:
“`r
dose.labs <- c("0.5" = "D0.5", "1" = "D1", "2" = "D2")
“`