
This article describes how to change ggplot legend size. You will learn how to modify the legend title and text size.
Related Book
GGPlot2 Essentials for Great Data Visualization in RPrerequisites
Load required packages and set the theme function theme_minimal() as the default theme:
library(ggplot2)
theme_set(theme_minimal())
Basic plot
Start by creating a box plot using the ToothGrowth data set. Change the box plot fill color according to the grouping variable dose.
ToothGrowth$dose <- as.factor(ToothGrowth$dose)
p <- ggplot(ToothGrowth, aes(x = dose, y = len))+
  geom_boxplot(aes(fill = dose)) +
  scale_fill_viridis_d()
p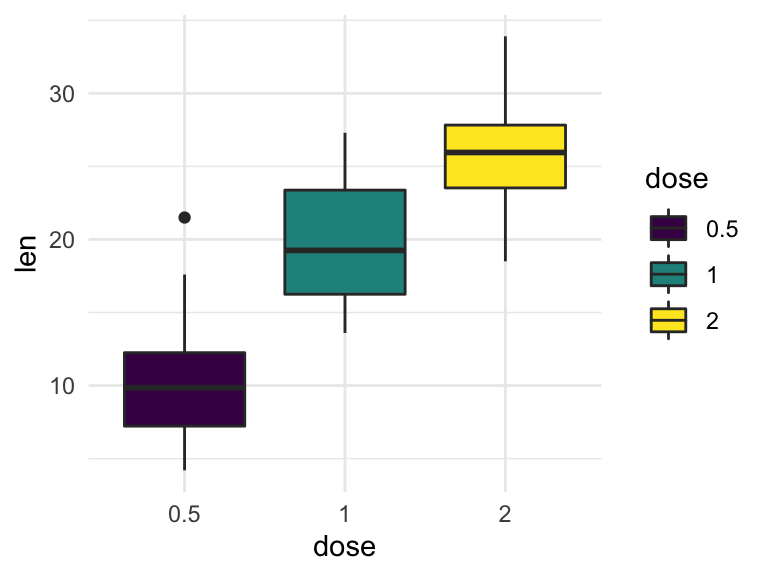
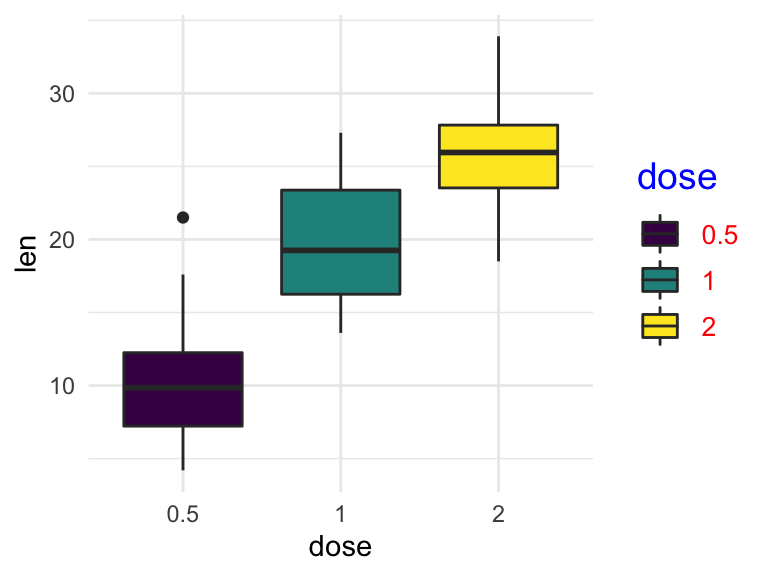
Chage legend size
The following R code modifies the size of the legend title and text:
p + theme(
  legend.title = element_text(color = "blue", size = 14),
  legend.text = element_text(color = "red", size = 10)
  )
Recommended for you
This section contains best data science and self-development resources to help you on your path.
Books - Data Science
Our Books
- Practical Guide to Cluster Analysis in R by A. Kassambara (Datanovia)
- Practical Guide To Principal Component Methods in R by A. Kassambara (Datanovia)
- Machine Learning Essentials: Practical Guide in R by A. Kassambara (Datanovia)
- R Graphics Essentials for Great Data Visualization by A. Kassambara (Datanovia)
- GGPlot2 Essentials for Great Data Visualization in R by A. Kassambara (Datanovia)
- Network Analysis and Visualization in R by A. Kassambara (Datanovia)
- Practical Statistics in R for Comparing Groups: Numerical Variables by A. Kassambara (Datanovia)
- Inter-Rater Reliability Essentials: Practical Guide in R by A. Kassambara (Datanovia)
Others
- R for Data Science: Import, Tidy, Transform, Visualize, and Model Data by Hadley Wickham & Garrett Grolemund
- Hands-On Machine Learning with Scikit-Learn, Keras, and TensorFlow: Concepts, Tools, and Techniques to Build Intelligent Systems by Aurelien Géron
- Practical Statistics for Data Scientists: 50 Essential Concepts by Peter Bruce & Andrew Bruce
- Hands-On Programming with R: Write Your Own Functions And Simulations by Garrett Grolemund & Hadley Wickham
- An Introduction to Statistical Learning: with Applications in R by Gareth James et al.
- Deep Learning with R by François Chollet & J.J. Allaire
- Deep Learning with Python by François Chollet
Version:
 Français


No Comments