This article describes how create easily an interactive web framework for exploring data in R using the datadigest package.
This tool provides a concise summary of every variable in a data frame and includes interactive features such as real-time filters, grouping, and highlighting.
This might be very helpful in exploring clinical trial data.
Required R packages and key functions
Load the datadigest package:
library(datadigest)Key R functions
#Summarize a single file
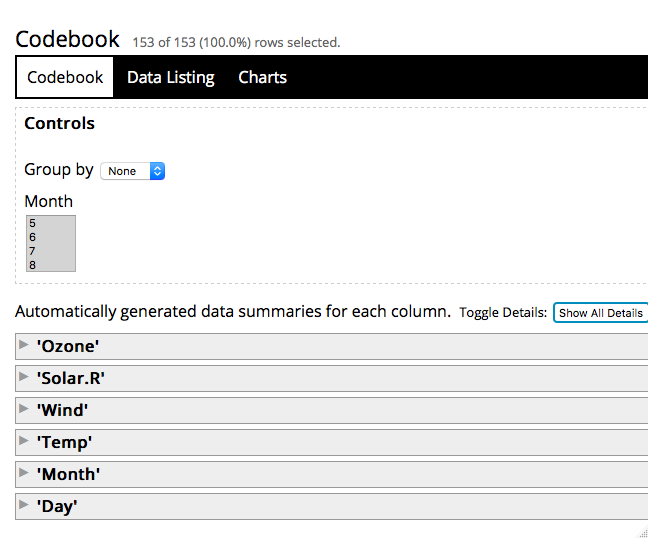
codebook(data = airquality)
# Explore multiple files
explorer(data = list(Cars = mtcars, Iris = iris), addEnv = FALSE)
# Run a shiny application
# Makes it possible to upload files
explorerApp()Explore interactively a data table
The main view available in the framework, include:
- CODEBOOK VIEW
- Shows a concise summary for each variable in the loaded data set.
- Users can click any variable to see additional details.
- Appropriate summary statistics, frequency tables and charts are provided.
- Histograms with box plots are drawn for continuous variables and bar charts for categorical variables. Variable level metadata is also shown beneath the chart if provided by the user.
- DATA LISTING VIEW
- Provides a simple tabular output so that the user can interact with the raw data.
- The listing is exportable, sortable and searchable.
- SETTINGS VIEW
- Lets users customize labels, hide variables and specify which columns should be used as interactive groups and filters.
- CHARTS VIEW
- Create simple bivariate data visualizations.
- The system automatically uses an appropriate visualization based on the types of the x and y variables selected.
Examples:
Recommended for you
This section contains best data science and self-development resources to help you on your path.
Books - Data Science
Our Books
- Practical Guide to Cluster Analysis in R by A. Kassambara (Datanovia)
- Practical Guide To Principal Component Methods in R by A. Kassambara (Datanovia)
- Machine Learning Essentials: Practical Guide in R by A. Kassambara (Datanovia)
- R Graphics Essentials for Great Data Visualization by A. Kassambara (Datanovia)
- GGPlot2 Essentials for Great Data Visualization in R by A. Kassambara (Datanovia)
- Network Analysis and Visualization in R by A. Kassambara (Datanovia)
- Practical Statistics in R for Comparing Groups: Numerical Variables by A. Kassambara (Datanovia)
- Inter-Rater Reliability Essentials: Practical Guide in R by A. Kassambara (Datanovia)
Others
- R for Data Science: Import, Tidy, Transform, Visualize, and Model Data by Hadley Wickham & Garrett Grolemund
- Hands-On Machine Learning with Scikit-Learn, Keras, and TensorFlow: Concepts, Tools, and Techniques to Build Intelligent Systems by Aurelien Géron
- Practical Statistics for Data Scientists: 50 Essential Concepts by Peter Bruce & Andrew Bruce
- Hands-On Programming with R: Write Your Own Functions And Simulations by Garrett Grolemund & Hadley Wickham
- An Introduction to Statistical Learning: with Applications in R by Gareth James et al.
- Deep Learning with R by François Chollet & J.J. Allaire
- Deep Learning with Python by François Chollet


Thanks for this!
Datadigest is a Great R pkg!.
The only thing that doesn’t work (for me),
is when you specify a “Group by” variable
in the top menu of Codebook.
It shows the message:
“…Stack exceeded…”.
It always works ok
if the “Group by” menu option
is set to: “None” (the default option).
So,
the menu option: “None” always works,
but choosing any other variable gives the error message.
Kassambara,
– can you please include a simple example
(say, with mtcars),
using the “Group by” option?.
*** THANKS!!! ***
It works for me! In the example, above, you can choose Group By Month, and it works.
Make sure you have the latest datadigest version.