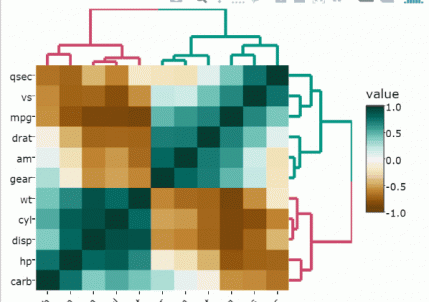
This articles describes how to create and customize an interactive heatmap in R using the heatmaply R package, which... 19 Apr How to Create a Beautiful Interactive Heatmap in R Alboukadel | Heatmap, Interactive Visualization | Cluster Analysis, Data Visualization | 0 This articles describes how to create and customize an interactive heatmap in R using the heatmaply R package, which...
Data normalization methods are used to make variables, measured in different scales, have comparable values. This preprocessing steps is... 18 Apr How to Normalize and Standardize Data in R for Great Heatmap Visualization Alboukadel | Heatmap, Interactive Visualization | Cluster Analysis, Data Visualization | 2 Data normalization methods are used to make variables, measured in different scales, have comparable values. This preprocessing steps is...
Missing values are generally represented by NA in a data frame. Here, we will describe how to visualize missing... 15 Apr How to Visualize Missing Data in R using a Heatmap Alboukadel | Heatmap, Interactive Visualization | Data Visualization, FAQ | 0 Missing values are generally represented by NA in a data frame. Here, we will describe how to visualize missing...
This articles describes how to create an interactive correlation matrix heatmap in R. You will learn two different approaches:... 11 Apr How to Create an Interactive Correlation Matrix Heatmap in R Alboukadel | Heatmap, Interactive Visualization | Correlation Analysis | 0 This articles describes how to create an interactive correlation matrix heatmap in R. You will learn two different approaches:...
This article describes how create easily an interactive web framework for exploring data in R using the datadigest package.... 16 Jan Simple Interactive Framework for Exploring Data in R Alboukadel | Interactive Visualization | Data Visualization | 2 This article describes how create easily an interactive web framework for exploring data in R using the datadigest package....