Introduction
Visual Studio Code (VSCode) paired with R provides a powerful, interactive environment for efficient data analysis and compelling visualization. In this guide, you’ll learn how to perform advanced data manipulation with tidyverse, visualize data with ggplot2, and interactively explore visualizations directly within VSCode.
Efficient Data Analysis in VSCode with R
VSCode’s integrated environment facilitates easy data loading, transformation, and analysis through intuitive workflows and immediate feedback.
STEP 1: Loading Data
Load and view your datasets seamlessly in VSCode:
Loading CSV Files:
# Create and load example CSV file
dir.create("data", showWarnings = FALSE)
readr::write_csv(iris, "data/iris.csv")
data <- readr::read_csv("data/iris.csv")
Interactive Data Viewing:
Inspect your dataset interactively using the built-in viewer:
View(data)
STEP 2: Data Wrangling with Tidyverse in VSCode
Leverage the powerful tidyverse ecosystem for efficient data manipulation:
Filtering and Transforming Data:
library(dplyr)
filtered_data <- data %>%
  filter(Sepal.Length > 5) %>%
  mutate(Sepal.Ratio = Sepal.Length / Sepal.Width)
Efficient Command Chaining with Pipes:
Streamline your data transformations using the
%>%operator, supported seamlessly in VSCode for interactive execution.
Advanced Data Visualization with ggplot2 in VSCode
Create informative visualizations directly within your VSCode environment using ggplot2:
STEP 1: Creating Compelling Visualizations
Produce clear, attractive visualizations interactively:
Basic Scatter Plot:
library(ggplot2)
ggplot(data, aes(x = Sepal.Length, y = Sepal.Width, color = Species)) +
  geom_point()
Interactive Plotting with httpgd:
Enable dynamic and interactive plot viewing:
install.packages("httpgd")
library(httpgd)
httpgd::hgd()
options(device = httpgd::hgd)
Plots appear interactively within the VSCode plot viewer, facilitating data exploration.
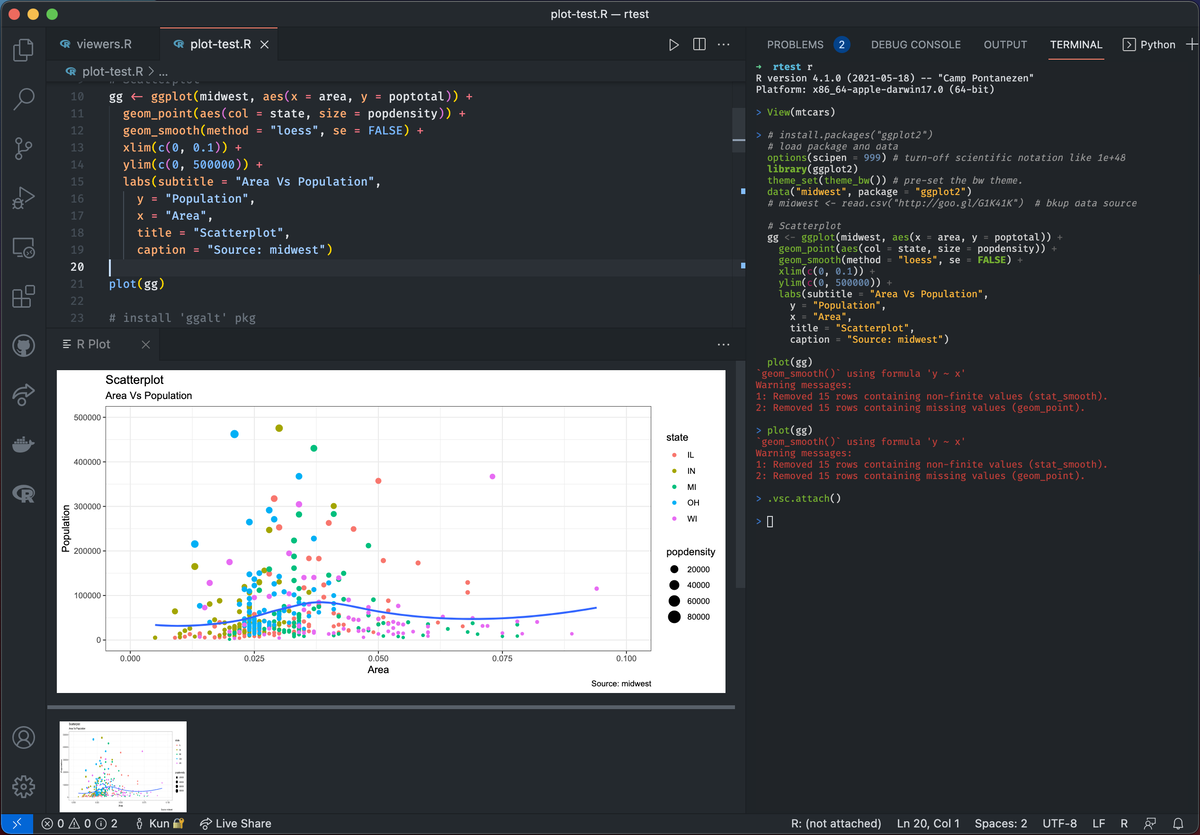
Plot viewer
STEP 2: Customizing Visualizations for Maximum Impact
Enhance plots for clarity and visual impact:
Titles, Labels, and Themes:
ggplot(data, aes(x = Sepal.Length, y = Sepal.Width, color = Species)) +
  geom_point() +
  labs(title = "Sepal Length vs Width",
       x = "Sepal Length (cm)",
       y = "Sepal Width (cm)") +
  theme_minimal()
Faceting for Clarity:
Use
facet_wrap()to analyze subsets clearly:ggplot(data, aes(x = Sepal.Length, y = Sepal.Width)) + geom_point() + facet_wrap(~ Species)
Interactive Visualization Tools in VSCode
Beyond static visuals, enhance your data analysis with interactive tools:
Interactive Plot Viewer: Leverage VSCode’s built-in interactive plot viewer for dynamic exploration with
httpgd.Interactive Widgets (Plotly, Shiny):
Integrate advanced interactive visualization tools directly into VSCode:
library(plotly)
p <- ggplot(data, aes(x = Sepal.Length, y = Sepal.Width, color = Species)) +
  geom_point()
ggplotly(p)
Debugging and Exploring Data Interactively
Efficiently debug, explore, and analyze data in real-time:
- Debugging with VSCode: Use breakpoints and interactive debugging (see detailed setup here).
- Workspace and Package Management: Efficiently manage your R workspace and packages within the VSCode sidebar.
Conclusion
Combining VSCode with R, tidyverse, ggplot2, and interactive visualization tools transforms your data analysis workflow. Interactive programming capabilities, dynamic visualization with httpgd, and advanced debugging features make VSCode a powerful environment for efficient data exploration, insightful analysis, and impactful data visualization.
References & Further Reading
Explore More Articles
Here are more articles from the same category to help you dive deeper into the topic.
Reuse
Citation
@online{kassambara2025,
  author = {Kassambara, Alboukadel},
  title = {Master {Data} {Analysis} \& {Visualization} with {R} in
    {VSCode}},
  date = {2025-03-23},
  url = {https://www.datanovia.com/learn/tools/r-in-vscode/data-analysis-and-visualization-with-r-in-vscode.html},
  langid = {en}
}