Introduction
R Markdown in Visual Studio Code (VSCode) offers a robust environment for generating dynamic, reproducible reports. Seamlessly integrate R code, narrative text, and visualizations in professional-quality documents.
This guide will help you master creating, executing, and customizing R Markdown reports directly within VSCode.
Prerequisites for R Markdown in VSCode
Before beginning, ensure your R environment in VSCode is properly configured:
- Follow Setting Up Your R Environment in VSCode.
- Install required packages:
- R package:
rmarkdown - VSCode extension:
vscode-R
- R package:
- Install Pandoc for document conversion if it’s not already installed.
Creating Your First R Markdown Document in VSCode
Follow these steps to create a new .Rmd file in VSCode:
New File Creation:
- Click
File > New File. - Save the file as
report.Rmd.
- Click
Add YAML Header:
The YAML header defines the report metadata and output format:
---
title: "My Analysis Report"
author: "Your Name"
date: "`r Sys.Date()`"
output: html_document
---
Writing Content:
Insert narrative and R code chunks easily:
## Introduction

This is an introductory example:

```{r}
summary(cars)
```
Executing R Code Chunks
Execute R code directly within your R Markdown document:
- Run Current Chunk:
Ctrl + Shift + Enter(Windows/Linux) orCmd + Shift + Enter(Mac). - Run Line or Selection: Highlight code, press
Ctrl + Enter(Windows/Linux) orCmd + Enter(Mac).
Outputs appear inline beneath code chunks for immediate viewing and validation.

Generating Dynamic Reports with R Markdown
Generate reproducible outputs such as HTML, PDF, or Word:
- Render Document:
- Open Command Palette (
Ctrl + Shift + P), selectRMarkdown: Render. - Choose your desired format (HTML, PDF, Word).
- Open Command Palette (
- View Generated Document:
- The rendered file appears in your project directory.
- HTML output can be directly previewed in the browser or via VSCode’s live preview extension.
Customizing Your R Markdown Output
Easily tailor your report outputs in the YAML header:
Custom Themes and Styles:
output:
  html_document:
    theme: cosmo
    highlight: haddock
Parameterized Reports:
Use parameters to customize reports dynamically:
params:
  data_file: "data.csv"
Reference parameters in your code using
params$data_file.
Inline R Code for Dynamic Content
Include dynamic, automatically updated content directly within narrative text:
As of `r Sys.Date()`, there are `r nrow(cars)` observations in the dataset.This enables automatic updates of your report based on underlying data changes.
Best Practices for Creating R Markdown Reports
Enhance readability, performance, and reproducibility:
Code Organization:
Label and organize chunks logically:
```{r data-import, echo=FALSE}
data <- read.csv("data.csv")
```
Use Caching for Performance:
Avoid re-running expensive computations:
```{r expensive-model, cache=TRUE}
model <- lm(mpg ~ wt + hp, data = mtcars)
```
Manage Visibility:
Control visibility of code and outputs:
```{r plot-results, echo=FALSE}
plot(mtcars$wt, mtcars$mpg)
```
Tips for Enhanced R Markdown in VSCode
- Live Preview: Install
Live Previewfor instant feedback while editing R Markdown. - Code Folding: Efficiently navigate large documents using VSCode’s built-in code-folding features.
- Linting & Formatting: Maintain clean and consistent R Markdown files with packages
lintrandstyler.
Full Example R Markdown Document
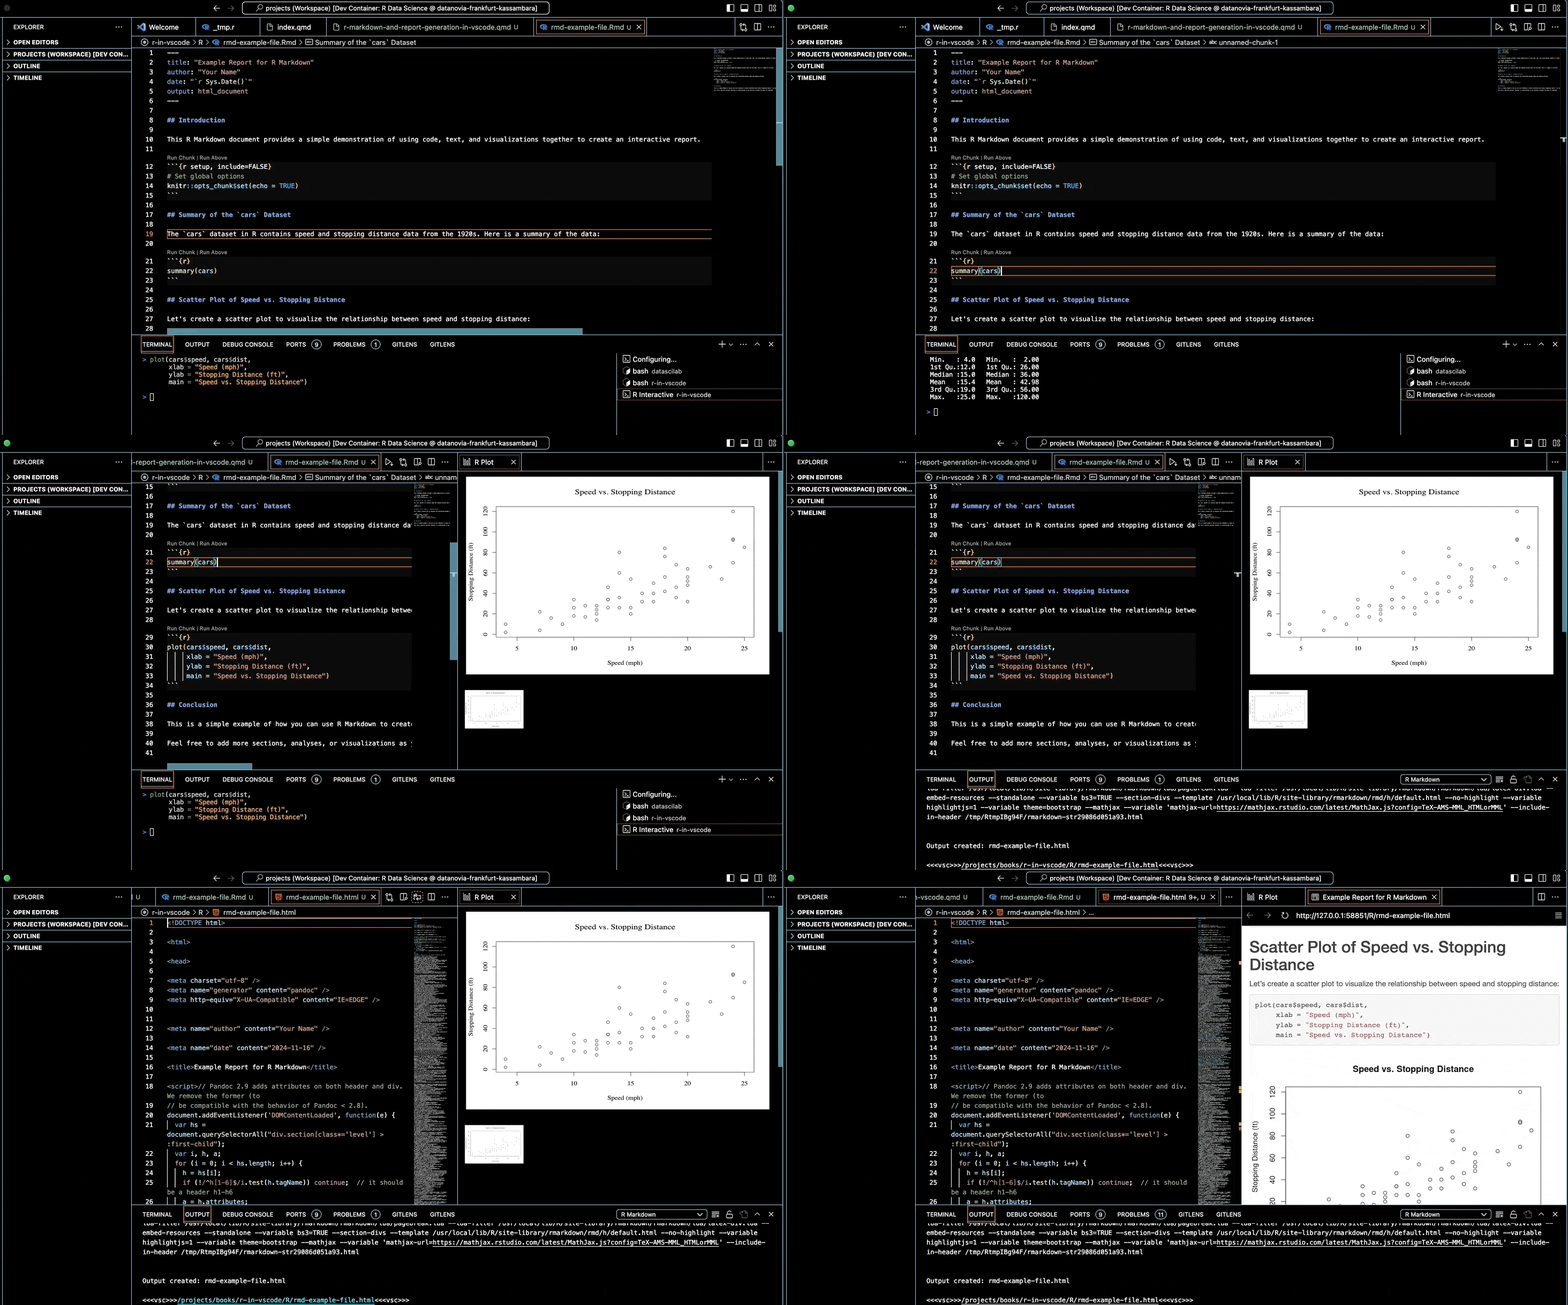
Here is a complete example demonstrating core R Markdown features:
---
title: 'Example Analysis with R Markdown'
author: 'Datanovia'
date: '`r Sys.Date()`'
output: html_document
---

## Introduction

An example showcasing R Markdown capabilities.

```{r setup, include=FALSE}
knitr::opts_chunk$set(echo = TRUE)
```

## Data Summary

The built-in `cars` dataset overview:

```{r}
summary(cars)
```

## Scatter Plot: Speed vs. Distance

Visual representation of the data:

```{r}
plot(cars$speed, cars$dist,
     xlab = "Speed (mph)",
     ylab = "Stopping Distance (ft)",
     main = "Speed vs. Stopping Distance")
```

## Conclusion

R Markdown simplifies dynamic, reproducible reporting by integrating analysis, narrative, and visuals.
Execution Output Example:

Conclusion
Mastering R Markdown in VSCode enables efficient creation of dynamic, professional, and reproducible reports. Integrate narrative, code, and visualizations effortlessly, streamlining your analytical workflow.
References & Further Reading
Explore More Articles
Here are more articles from the same category to help you dive deeper into the topic.
Reuse
Citation
@online{kassambara2025,
  author = {Kassambara, Alboukadel},
  title = {R {Markdown} in {VSCode}},
  date = {2025-03-23},
  url = {https://www.datanovia.com/learn/tools/r-in-vscode/r-markdown-and-report-generation-in-vscode.html},
  langid = {en}
}
