This article describes how to create animation in R using the gganimate R package.
gganimate is an extension of the ggplot2 package for creating animated ggplots. It provides a range of new functionality that can be added to the plot object in order to customize how it should change with time.
Key features of gganimate:
- transitions: you want your data to change
- views: you want your viewpoint to change
- shadows: you want the animation to have memory
Contents:
Prerequisites
gganimate stable version is available on CRAN and can be installed with install.packages('gganimate'). The latest development version can be installed as follow: devtools::install_github('thomasp85/gganimate').
Note that, in this tutorial, we used the latest developmental version.
Load required packages and set the default ggplot2 theme to theme_bw():
library(ggplot2)
library(gganimate)
theme_set(theme_bw())
Demo dataset
library(gapminder)
head(gapminder)
## # A tibble: 6 x 6
## country continent year lifeExp pop gdpPercap
## <fct> <fct> <int> <dbl> <int> <dbl>
## 1 Afghanistan Asia 1952 28.8 8425333 779.
## 2 Afghanistan Asia 1957 30.3 9240934 821.
## 3 Afghanistan Asia 1962 32.0 10267083 853.
## 4 Afghanistan Asia 1967 34.0 11537966 836.
## 5 Afghanistan Asia 1972 36.1 13079460 740.
## 6 Afghanistan Asia 1977 38.4 14880372 786.Static plot
p <- ggplot(
  gapminder,
  aes(x = gdpPercap, y=lifeExp, size = pop, colour = country)
  ) +
  geom_point(show.legend = FALSE, alpha = 0.7) +
  scale_color_viridis_d() +
  scale_size(range = c(2, 12)) +
  scale_x_log10() +
  labs(x = "GDP per capita", y = "Life expectancy")
p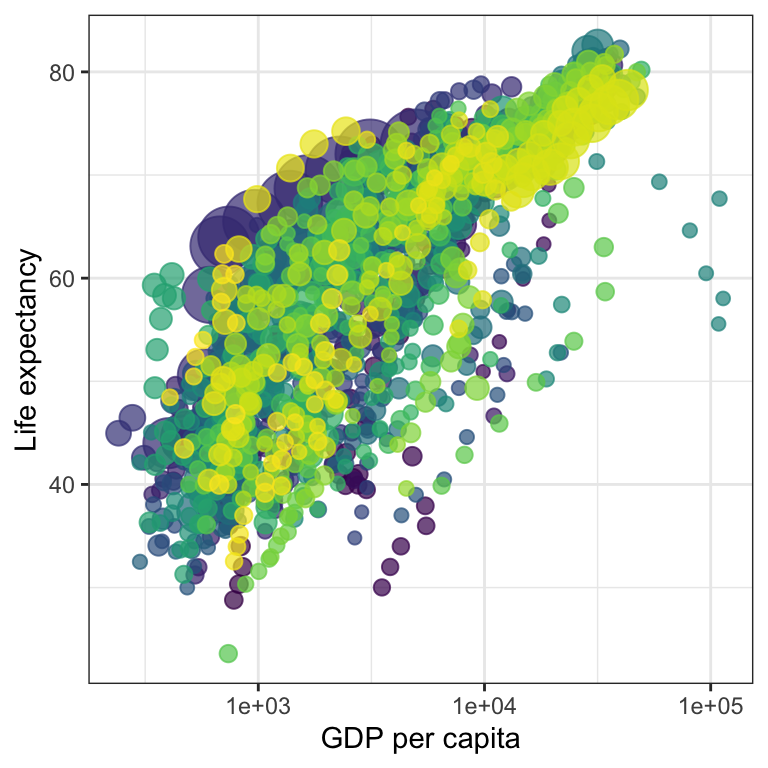
Transition through distinct states in time
Basics
Key R function: transition_time(). The transition length between the states will be set to correspond to the actual time difference between them.
Label variables: frame_time. Gives the time that the current frame corresponds to.
p + transition_time(year) +
  labs(title = "Year: {frame_time}")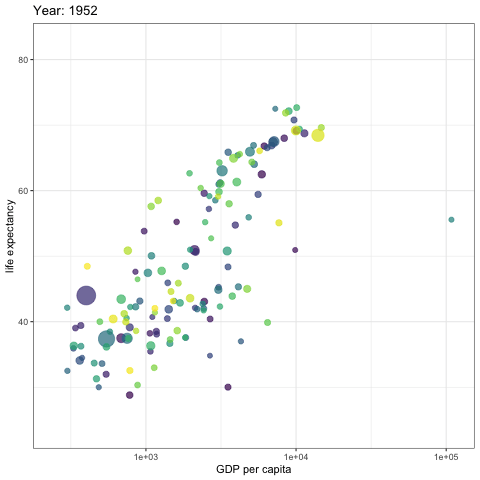
Create facets by continent:
p + facet_wrap(~continent) +
  transition_time(year) +
  labs(title = "Year: {frame_time}")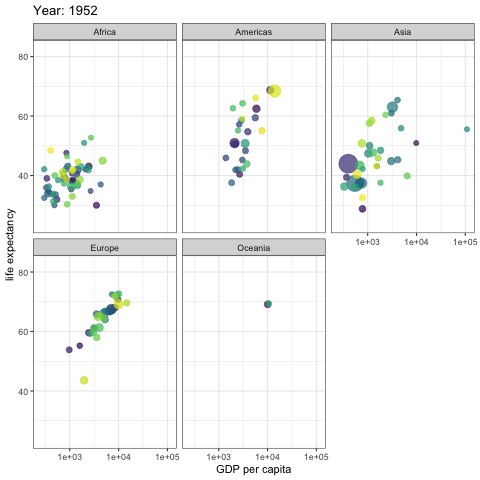
Let the view follow the data in each frame
p + transition_time(year) +
  labs(title = "Year: {frame_time}") +
  view_follow(fixed_y = TRUE)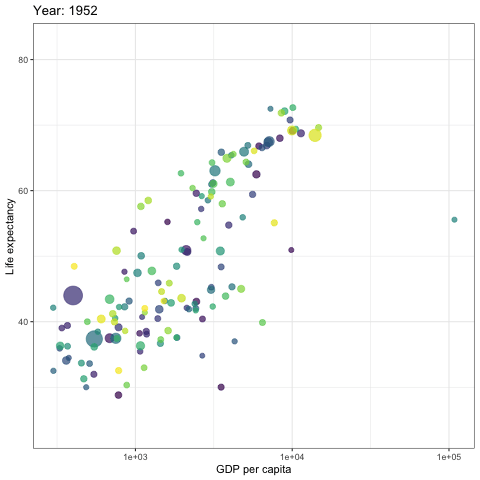
Show preceding frames with gradual falloff
This shadow is meant to draw a small wake after data by showing the latest frames up to the current. You can choose to gradually diminish the size and/or opacity of the shadow. The length of the wake is not given in absolute frames as that would make the animation susceptible to changes in the framerate. Instead it is given as a proportion of the total length of the animation.
p + transition_time(year) +
  labs(title = "Year: {frame_time}") +
  shadow_wake(wake_length = 0.1, alpha = FALSE)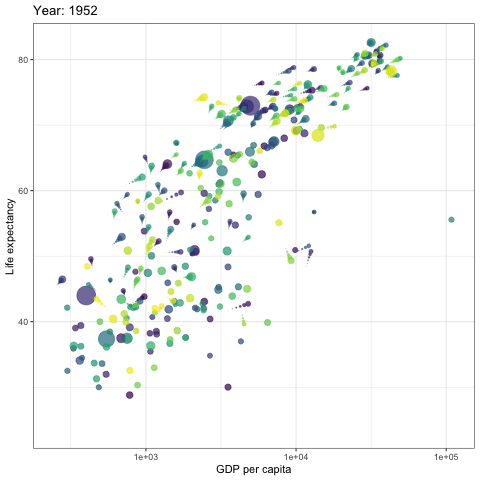
Show the original data as background marks
This shadow lets you show the raw data behind the current frame. Both past and/or future raw data can be shown and styled as you want.
p + transition_time(year) +
  labs(title = "Year: {frame_time}") +
  shadow_mark(alpha = 0.3, size = 0.5)
Reveal data along a given dimension
This transition allows you to let data gradually appear, based on a given time dimension.
Static plot
p <- ggplot(
  airquality,
  aes(Day, Temp, group = Month, color = factor(Month))
  ) +
  geom_line() +
  scale_color_viridis_d() +
  labs(x = "Day of Month", y = "Temperature") +
  theme(legend.position = "top")
p
Let data gradually appear
- Reveal by day (x-axis)
p + transition_reveal(Day)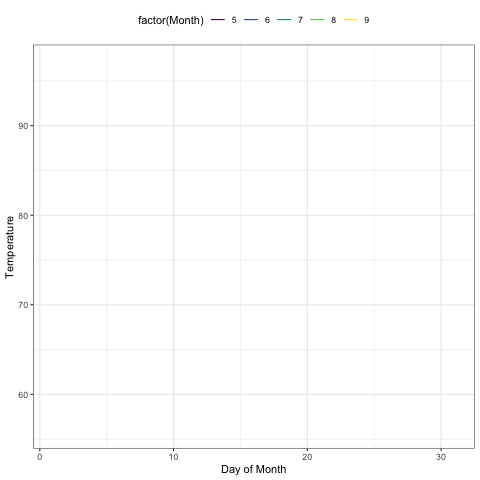
- Show points:
p +
  geom_point() +
  transition_reveal(Day)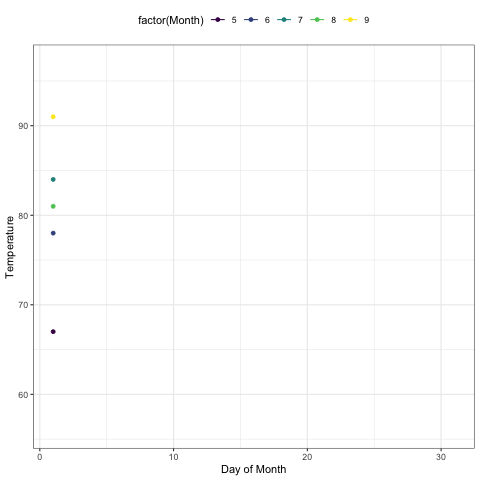
- Points can be kept by giving them a unique group:
p +
  geom_point(aes(group = seq_along(Day))) +
  transition_reveal(Day)
Transition between several distinct stages of the data
Data preparation:
library(dplyr)
mean.temp <- airquality %>%
  group_by(Month) %>%
  summarise(Temp = mean(Temp))
mean.temp
## # A tibble: 5 x 2
## Month Temp
## <int> <dbl>
## 1 5 65.5
## 2 6 79.1
## 3 7 83.9
## 4 8 84.0
## 5 9 76.9Create a bar plot of mean temperature:
p <- ggplot(mean.temp, aes(Month, Temp, fill = Temp)) +
  geom_col() +
  scale_fill_distiller(palette = "Reds", direction = 1) +
  theme_minimal() +
  theme(
    panel.grid = element_blank(),
    panel.grid.major.y = element_line(color = "white"),
    panel.ontop = TRUE
  )
p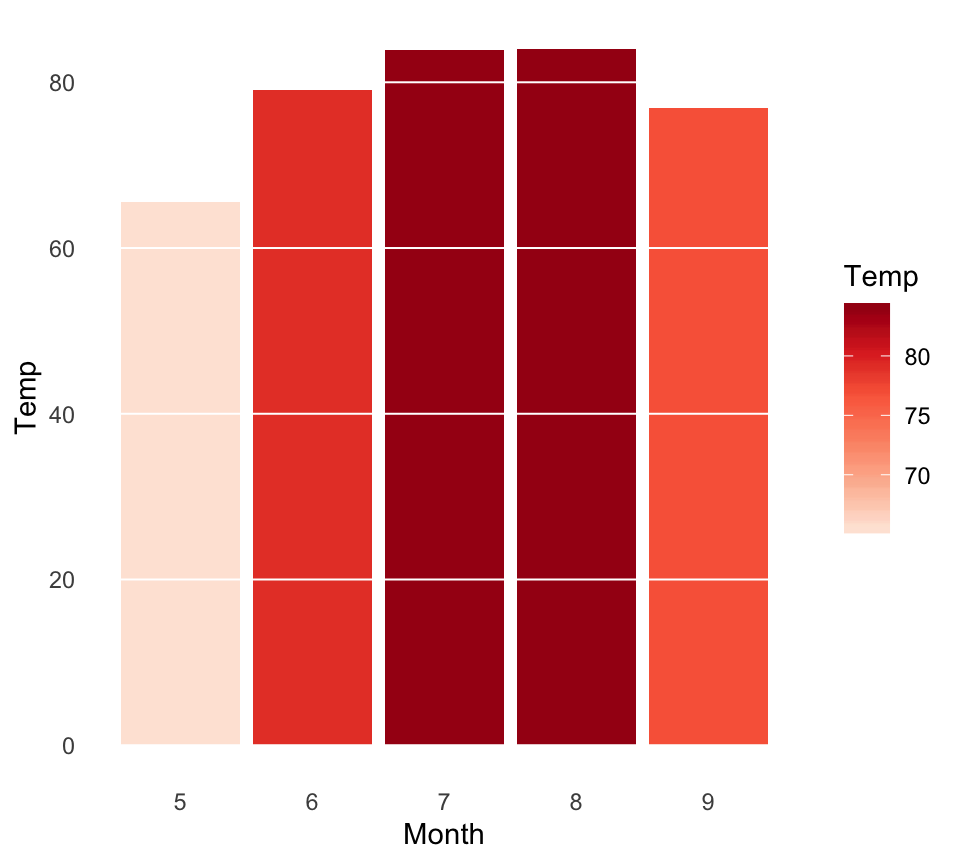
- transition_states():
p + transition_states(Month, wrap = FALSE) +
  shadow_mark()
- enter_grow() + enter_fade()
p + transition_states(Month, wrap = FALSE) +
  shadow_mark() +
  enter_grow() +
  enter_fade()
Save animation
If you need to save the animation for later use you can use the anim_save() function.
It works much like ggsave() from ggplot2 and automatically grabs the last rendered animation if you do not specify one directly.
Example of usage:
Read more
Recommended for you
This section contains best data science and self-development resources to help you on your path.
Books - Data Science
Our Books
- Practical Guide to Cluster Analysis in R by A. Kassambara (Datanovia)
- Practical Guide To Principal Component Methods in R by A. Kassambara (Datanovia)
- Machine Learning Essentials: Practical Guide in R by A. Kassambara (Datanovia)
- R Graphics Essentials for Great Data Visualization by A. Kassambara (Datanovia)
- GGPlot2 Essentials for Great Data Visualization in R by A. Kassambara (Datanovia)
- Network Analysis and Visualization in R by A. Kassambara (Datanovia)
- Practical Statistics in R for Comparing Groups: Numerical Variables by A. Kassambara (Datanovia)
- Inter-Rater Reliability Essentials: Practical Guide in R by A. Kassambara (Datanovia)
Others
- R for Data Science: Import, Tidy, Transform, Visualize, and Model Data by Hadley Wickham & Garrett Grolemund
- Hands-On Machine Learning with Scikit-Learn, Keras, and TensorFlow: Concepts, Tools, and Techniques to Build Intelligent Systems by Aurelien Géron
- Practical Statistics for Data Scientists: 50 Essential Concepts by Peter Bruce & Andrew Bruce
- Hands-On Programming with R: Write Your Own Functions And Simulations by Garrett Grolemund & Hadley Wickham
- An Introduction to Statistical Learning: with Applications in R by Gareth James et al.
- Deep Learning with R by François Chollet & J.J. Allaire
- Deep Learning with Python by François Chollet


nice write up!!! thanks
had a query.. any insight how do I fade the other lines when I reveal current line… in transition_reveal
this will give clear visibility to transition_reveal in case too many are in perpective
I hope I could clearly give the problem statement
This is beautiful! I love it! I want to use it but in my data set.
May I ask you to provide an example of the anim_save ( ) function, please, since the examples I found do not work for me. Thank you!
Hi Draga,
I’ve been using the function animate () in order to save the output.
Example:
animate(p, nframes=x, height=y, width=w, res=z, gifski_renderer(“my.gif”))
So in this case I’m specifying the number of frames, height, width and also the resolution of the output.
I hope it helps
Cheers
Dear Tiago,
Many thanks for your kind answer. It works. I would like to know is it possible to change the color for one specific country, for example, red color only for China (and how)? I would appreciate your answer. Many thanks in advance.
I missed to let you know that I would like to change the color only for China for your second chart (Transition through distinct states in time). Thank you.
How would you animate showing a years worth of monthly date throughout 20 years, scrolling right to left, e.g. Jan to Dec 2000, then Feb 2000 to Jan 2001 etc. Each frame would show each of the twelve months. So you would see the data floating right to left throughout the months and years.
Hi, this is fantastic stuff. Unfortunately, my efforts fall down repeatedly when I run various examples from this and other websites. I always get an Error: Don’t know how to add transition_states (…or transition_dates, etc. ) to a plot. I’ve downloaded “Fix version check to match the ggplot2 hotfix” but don’t know how to incorporate it into the gganimate code. I’m a complete novice so please bare with me :/
Very awesome topic for me. Thank for this site and share an important technic for learner like me.
we got error with along data to be provided:
with this code
p + geom_point() + transition_reveal(Day)
I include it with transition_reveal(Month,Day). It work well.
Hi, great explanation,
how do you change the size and fps of the gif? mine is very small (about 1/4 of the window) and running quite fast.
Thanks
Hive you tried the command `animate(p, fps=1)` ? as indicated on stackoverlow: https://stackoverflow.com/questions/52244347/control-speed-of-a-gganimation
animate(plot, width = 700, height = 700, duration = 15)
## You can adjust the size by changing width and height. The duration can be changed to 20 seconds, 15 seconds or anything.
Note you can also use:
renderer = gifski_renderer(loop = F) #to stop looping your animation. Enjoy!
The article is very useful for me.
i have used this line:
animate(p, nframes=Quantity, heigh=StockCode, width=w, res=z, gifski_renderer(“new1.gif”))
error:
Error in animate.default(p, nframes = Quantity, heigh = StockCode, width = w, :
animation of gg objects not supported
please give the guidance sir
Hi, i have problem with the path to save.
“Warning message:
file_renderer failed to copy frames to the destination directory”
I think this might fix your issue, if you have a Mac anyway. I struggled for a good minute with this as well. https://youtu.be/VfLRhPEuYDc
Thank you for this helpful link!
I have geo-rectified rasterLayers with the extent of 11 passes of a wild fire taken by an aircraft with an IR camera. I’d like to show the passes sequentially to show the temperature changes. How can I do this with gganimate?
this is beautiful
Thank you for the positive feedback!
the static charts appear without any problem, Animation renders but doesnt appear in. iMac, with R 4.0.0.0, what am I doing wrong
The code wortks very well in Rstudio in iMac, RStudio is using R 4.0.0.0, possibly the viewer makes the difference, thank you so much
Good to know, thank you for this information!
Hey, it’s a great work. I have a further question regarding the package. Is it possible to shade the path of the data regarding an additional variable?
I’ve got spacial data and I would like to adjust the shading the path adjusting for the temperature of my moving objects. The data is given for each time point.
Thank you kindly for your reply!
Thanks for sharing great animation. When I execute the following command
p + transition_time(year) +
labs(title = “Year: {frame_time}”)
I get no animation and get the following message.
Warning message:
file_renderer failed to copy frames to the destination directory
Hi,
Very nice site, congrats!
I have some problems with the quality of my animations which are jerky and interrupted by sort of green flashes
see:https://ibb.co/cLFkBwJ
Any idea?
many thanks in advance and congrats again
Anthony
Code example:
library(gganimate)
library(png)
library(ggplot2)
library(gifski)
theme_set(theme_bw())
p<-ggplot(data=data,aes(x=d13C,y=d15N,color=group,shape=Place))+
geom_point(show.legend = TRUE, alpha = 0.7)+
scale_color_manual(values = c("Grey","Lightblue","Black","Blue"))+
transition_states(Time,transition_length = 3) +
#labs(title = "Time: {frame_time}")+
shadow_wake(wake_length = 0.1, alpha = FALSE)+
shadow_mark(alpha = 0.3, size = 0.5)
animate(p, renderer = gifski_renderer())
anim_save("test.gif")
Does this work with the EnhancedVolcano package?