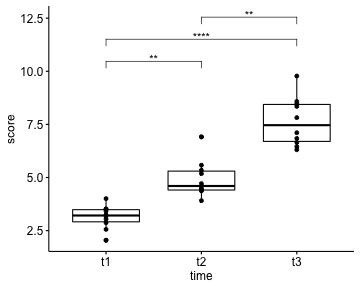
Prerequisites # Load required R packages library(tidyverse) library(rstatix) library(ggpubr) Data preparation We’ll use the self-esteem score dataset measured over three time points. The data is available in the datarium package.
Prerequisites # Load required R packages library(tidyverse) library(rstatix) library(ggpubr) Data preparation We’ll use the self-esteem score dataset measured over three time points. The data is available in the datarium package.