Blog

We provide practical tutorials on data mining, visualization and statistics for decision making.

Version: Français

Different distance measures are available for clustering analysis. This article describes how to perform clustering in R using correlation as distance metrics. Contents: Prerequisites Demo data Draw heatmaps using pheatmap

Clustering using Correlation as Distance Measures in R

Different distance measures are available for clustering analysis. This article describes how to perform clustering in R using correlation as distance metrics. Contents: Prerequisites Demo data Draw heatmaps using pheatmap

This article describes how to extract text from PDF in R using the pdftools package. Contents: Installation Load the package Extract the PDF text content Render the pdf pages as

Extract Text from PDF in R

This article describes how to extract text from PDF in R using the pdftools package. Contents: Installation Load the package Extract the PDF text content Render the pdf pages as

This article presents the fs R package, which provides a cross-platform, uniform interface to file system operations. fs functions are divided into four main categories: path_ for manipulating and constructing

How to Easily Manipulate Files and Directories in R

This article presents the fs R package, which provides a cross-platform, uniform interface to file system operations. fs functions are divided into four main categories: path_ for manipulating and constructing

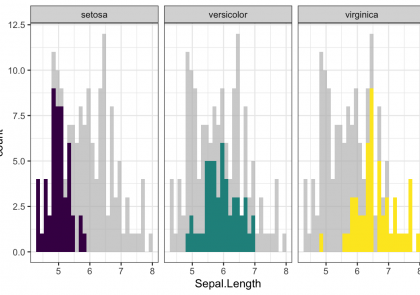
This article presents how to easily highlight a ggplot using the gghighlight package. Contents: Prerequisites Line plot Histogram Scatter plot Bar plot Prerequisites Load required packages and set the default

gghighlight: Easy Way to Highlight a GGPlot in R

This article presents how to easily highlight a ggplot using the gghighlight package. Contents: Prerequisites Line plot Histogram Scatter plot Bar plot Prerequisites Load required packages and set the default

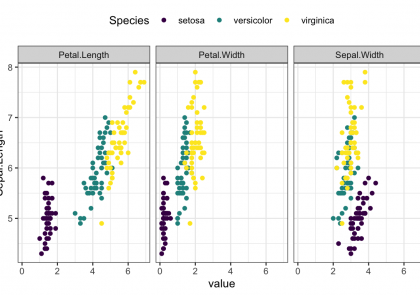
This article shows how to visualize one numeric variable against multiple others. Prerequisites Load required R package and set the default theme to theme_bw() : library(tidyverse) theme_set( theme_bw() + theme(legend.position

How to Plot One Variable against Multiple Others

This article shows how to visualize one numeric variable against multiple others. Prerequisites Load required R package and set the default theme to theme_bw() : library(tidyverse) theme_set( theme_bw() + theme(legend.position

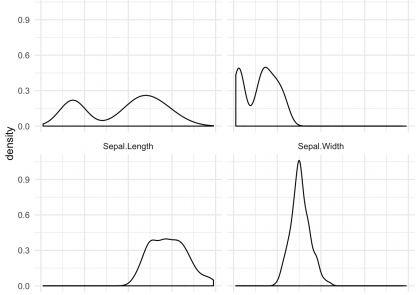
You will learn how to plot all variables in a data frame using the ggplot2 R package. Prerequisites Load required R package and set the default theme to theme_minimal() :

How to Plot All Variables in a Dataset

You will learn how to plot all variables in a data frame using the ggplot2 R package. Prerequisites Load required R package and set the default theme to theme_minimal() :

This article describes how to plot a correlation network in R using the corrr package. Related article: Easy Correlation Matrix Analysis in R Using Corrr Package Contents: Load required R

Easily Create a Correlation Network in R using the Corrr Package

This article describes how to plot a correlation network in R using the corrr package. Related article: Easy Correlation Matrix Analysis in R Using Corrr Package Contents: Load required R