Blog

We provide practical tutorials on data mining, visualization and statistics for decision making.

Version: Français

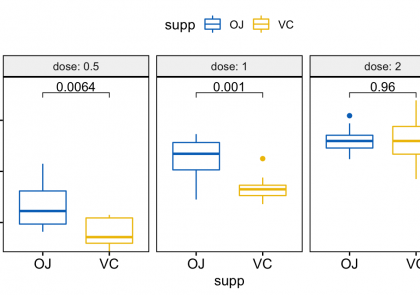
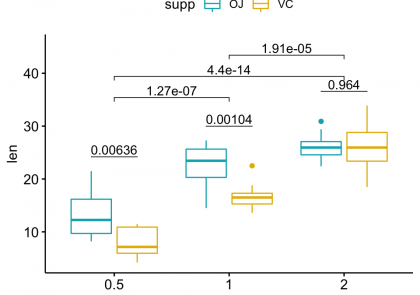
This article describes how to compute and automatically add p-values onto grouped ggplots using the ggpubr and the rstatix R packages. You will learn how to: Add p-values onto grouped

How to Add P-Values onto a Grouped GGPLOT using the GGPUBR R Package

This article describes how to compute and automatically add p-values onto grouped ggplots using the ggpubr and the rstatix R packages. You will learn how to: Add p-values onto grouped

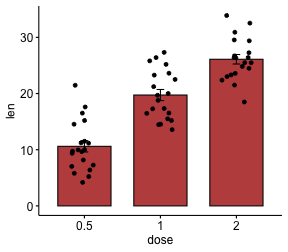
This article describes how to easily create barplots with error bars in R using the ggpubr package, an extension of ggplot2 for creating publication ready plots. The following R code

How to Easily Create Barplots with Error Bars in R

This article describes how to easily create barplots with error bars in R using the ggpubr package, an extension of ggplot2 for creating publication ready plots. The following R code

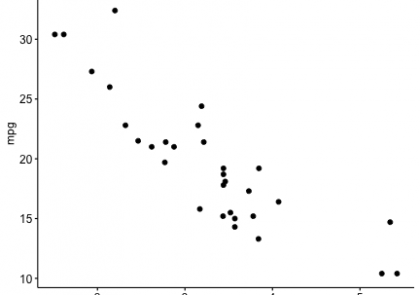
library(ggpubr) # Create a basic plot p <- ggscatter(mtcars, x = "wt", y = "mpg") p # Increase the number of ticks p + scale_x_continuous(breaks = get_breaks(n = 10)) +

How to Easily Set Axis Ticks Number for Numeric Variables

library(ggpubr) # Create a basic plot p <- ggscatter(mtcars, x = "wt", y = "mpg") p # Increase the number of ticks p + scale_x_continuous(breaks = get_breaks(n = 10)) +

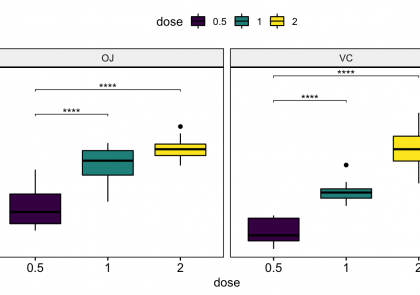
  This article describes how to add p-values generated elsewhere to a ggplot using the ggpubr package. The following key ggpubr functions will be used: stat_pvalue_manual(): Add manually p-values to

GGPUBR: How to Add P-Values Generated Elsewhere to a GGPLOT

  This article describes how to add p-values generated elsewhere to a ggplot using the ggpubr package. The following key ggpubr functions will be used: stat_pvalue_manual(): Add manually p-values to

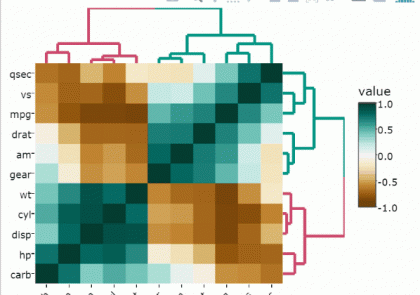
This articles describes how to create and customize an interactive heatmap in R using the heatmaply R package, which is based on the ggplot2 and plotly.js engine. Contents: Prerequisites Data

How to Create a Beautiful Interactive Heatmap in R

This articles describes how to create and customize an interactive heatmap in R using the heatmaply R package, which is based on the ggplot2 and plotly.js engine. Contents: Prerequisites Data

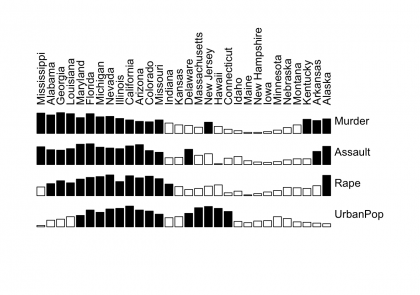
This article describes seriation methods, which consists of finding a suitable linear order for a set of objects in data using loss or merit functions. There are different seriation algorithms.

Seriation in R: How to Optimally Order Objects in a Data Matrice

This article describes seriation methods, which consists of finding a suitable linear order for a set of objects in data using loss or merit functions. There are different seriation algorithms.

Data normalization methods are used to make variables, measured in different scales, have comparable values. This preprocessing steps is important for clustering and heatmap visualization, principal component analysis and other

How to Normalize and Standardize Data in R for Great Heatmap Visualization

Data normalization methods are used to make variables, measured in different scales, have comparable values. This preprocessing steps is important for clustering and heatmap visualization, principal component analysis and other

Missing values are generally represented by NA in a data frame. Here, we will describe how to visualize missing data in R using an interactive heatmap. Contents: Prerequisites Show missing

How to Visualize Missing Data in R using a Heatmap

Missing values are generally represented by NA in a data frame. Here, we will describe how to visualize missing data in R using an interactive heatmap. Contents: Prerequisites Show missing

This articles describes how to create an interactive correlation matrix heatmap in R. You will learn two different approaches: Using the heatmaply R package Using the combination of the ggcorrplot

How to Create an Interactive Correlation Matrix Heatmap in R

This articles describes how to create an interactive correlation matrix heatmap in R. You will learn two different approaches: Using the heatmaply R package Using the combination of the ggcorrplot