
This article provides amazing list of R colors that you can use to create beautiful graphics. Colors can be specified either by names or by hexadecimal color codes. There are also some predefined colors in R that you can use; these include RColorBrewer, viridis and ggsci color palettes. Read more at: Top R Color Palettes to Know for Great Data Visualization
In this tutorial, you will learn the different available colors, as well as, how to use them in ggplot2 and in R base plots.
Contents:
Load required packages
Load ggplot2 and set default plot theme:
library(ggplot2)
theme_set(theme_bw())
R color names
There are a list of 657 color names that R knows about.
A sample of these R color names are illustrated in the image below:

- Usage in base plot:
barplot(c(2, 5), col = c("darkcyan", "darkgoldenrod1"))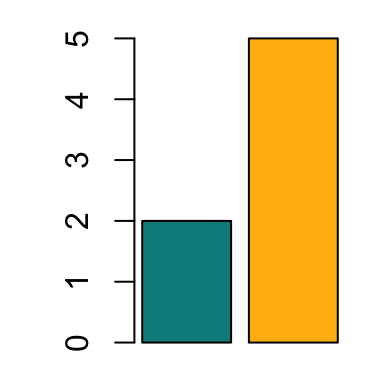
- Usage in ggplots:
ggplot(iris, aes(Species, Sepal.Length)) +
geom_boxplot(fill = "darkcyan") 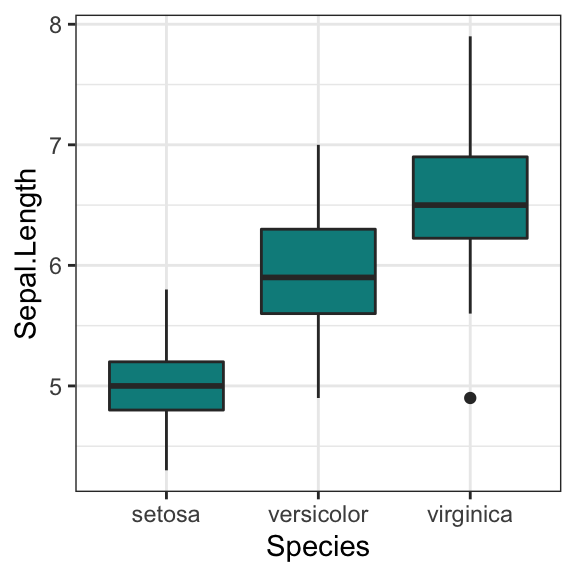
Hexadecimal colors
The following image shows example of hexadecimal color codes that you can choose:
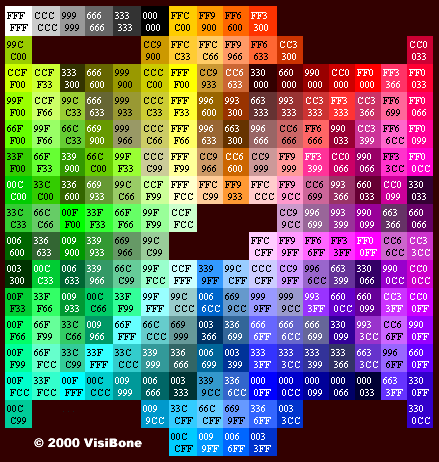
(Source: http://www.visibone.com)
- Usage in base plot:
barplot(c(2, 5), col = c("#009999", "#0000FF"))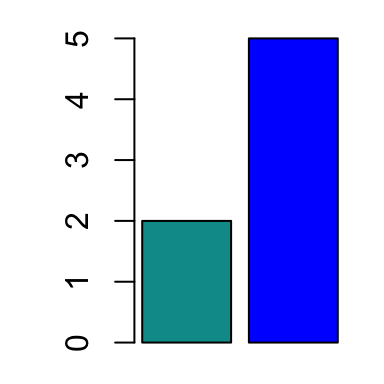
- Usage in ggplots:
ggplot(iris, aes(Species, Sepal.Length)) +
  geom_boxplot(aes(fill = Species)) +
  scale_fill_manual(values = c("#00AFBB", "#E7B800", "#FC4E07"))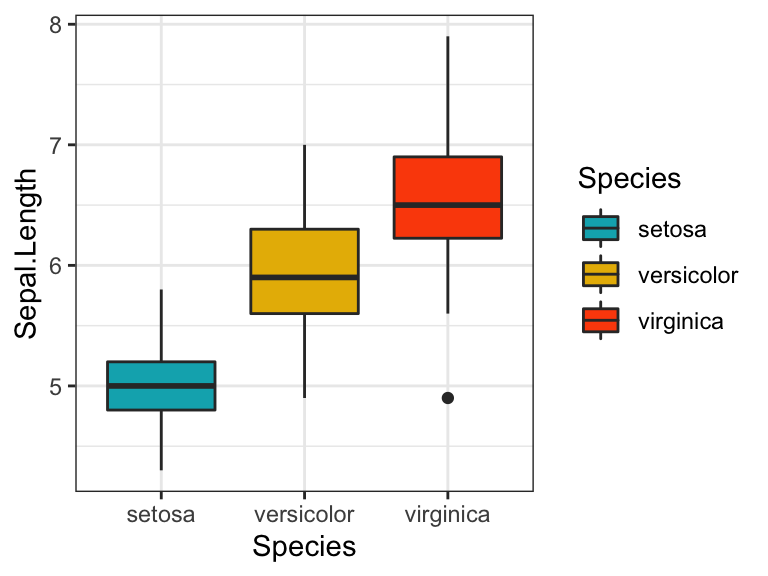
Predefined R color palettes
We have already described the best predefined R color palettes in our previous article: Top R Color Palettes to Know for Great Data Visualization.
In this section, we’ll present briefly RColorBrewer, viridis, ggsci and Wes Anderson color palettes.
RColorBrewer palettes
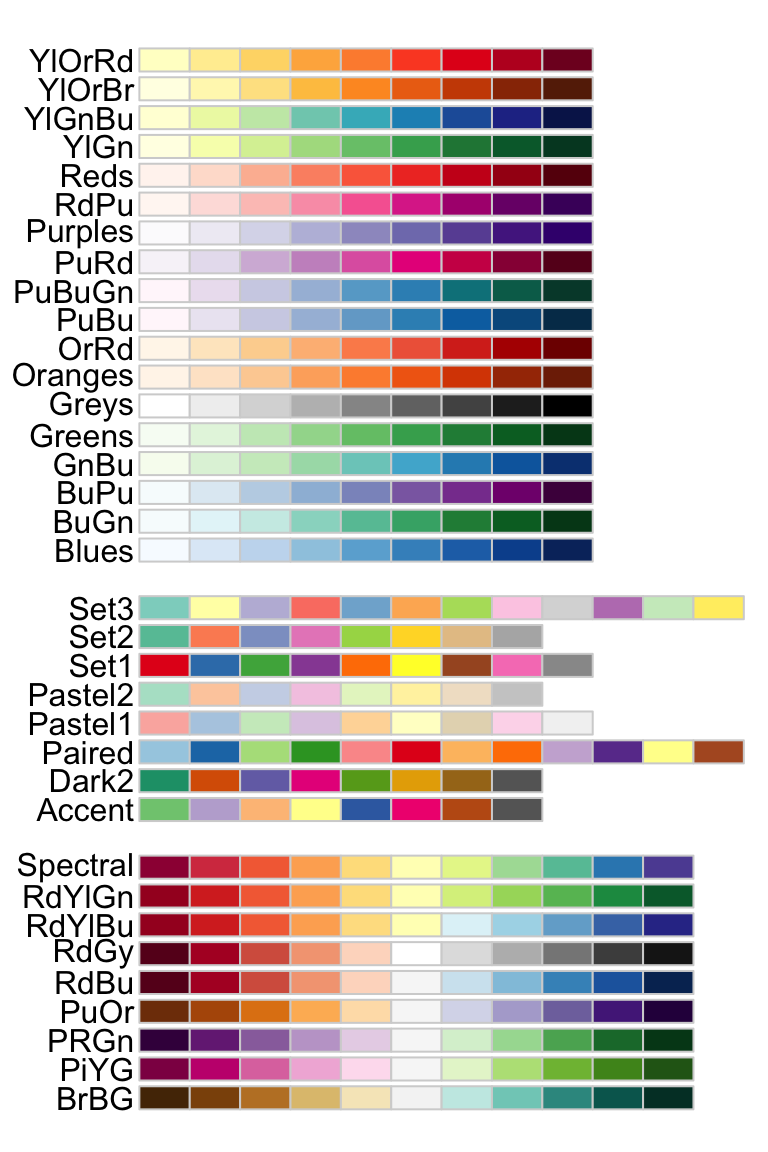
- First, load the package as follow:
library("RColorBrewer")- Usage in base plot:
barplot(c(2, 5, 8), col = brewer.pal(n = 3, name = "Dark2"))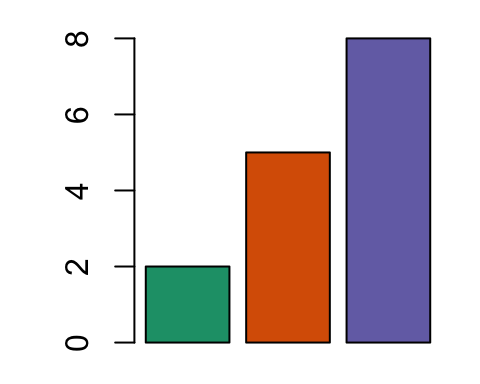
- Usage in ggplots:
ggplot(iris, aes(Species, Sepal.Length)) +
  geom_boxplot(aes(fill = Species)) +
  scale_fill_brewer(palette = "Dark2")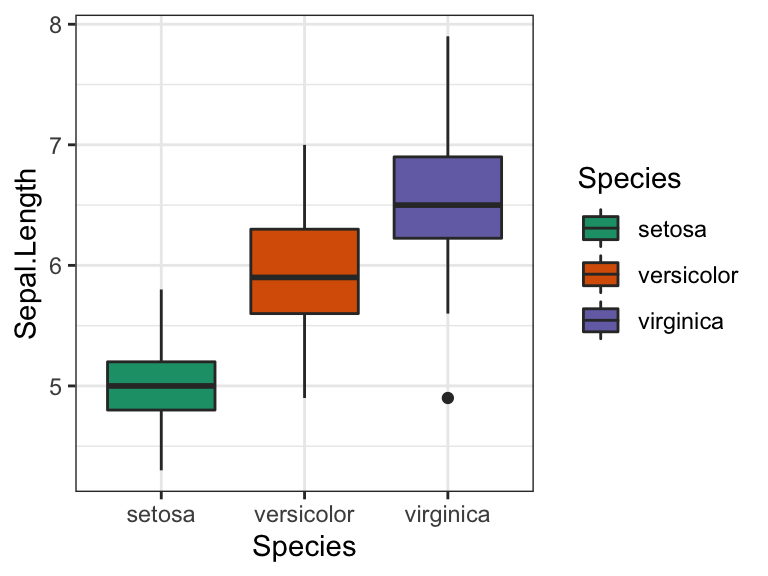
Read more at: The A – Z Of Rcolorbrewer Palette
Viridis color palettes
- First, load the package as follow:
library("viridis")- Usage in R base plots
barplot(c(2, 5, 8), col = viridis(3))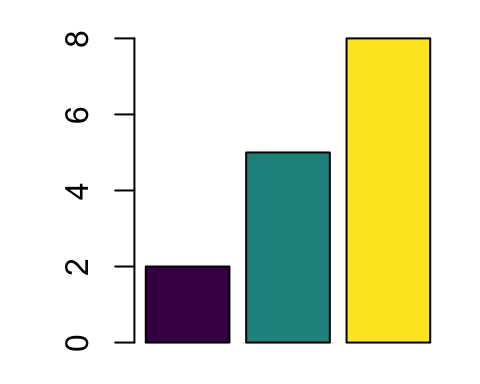
- Usage in ggplots:
ggplot(iris, aes(Species, Sepal.Length)) +
  geom_boxplot(aes(fill = Species)) +
  scale_fill_viridis(discrete = TRUE)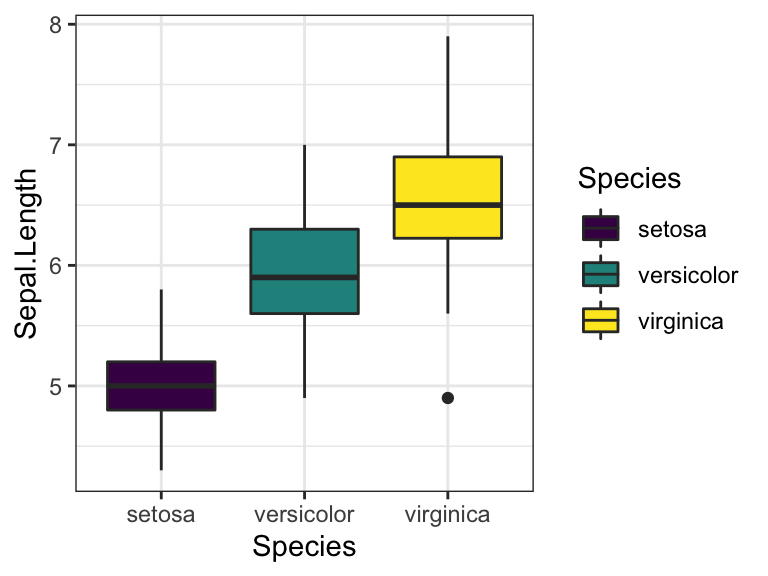
Read more at: Viridis color palettes
Scientific journal color palettes
The ggsci R package contains a collection of high-quality color palettes inspired by colors used in scientific journals, data visualization libraries, and more. For example:
scale_color_npg()andscale_fill_npg(): Nature Publishing Groupscale_color_aaas()andscale_fill_aaas(): American Association for the Advancement of Sciencescale_color_lancet()andscale_fill_lancet(): Lancet journalscale_color_jco()andscale_fill_jco(): Journal of Clinical Oncology
Note that for base plots, you can use the corresponding palette generator for creating a list of colors. For example, you can use: pal_npg(), pal_aaas(), pal_lancet(), pal_jco(), and so on.
- First, load the package as follow:
library("ggsci")- Usage in R base plots
barplot(c(2, 5, 8), col = pal_jco()(3))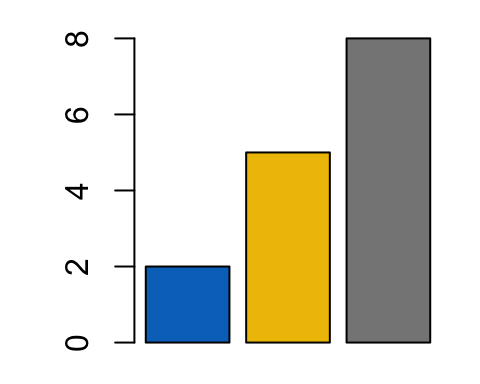
- Usage in ggplots:
ggplot(iris, aes(Species, Sepal.Length)) +
  geom_boxplot(aes(fill = Species)) +
  scale_fill_jco()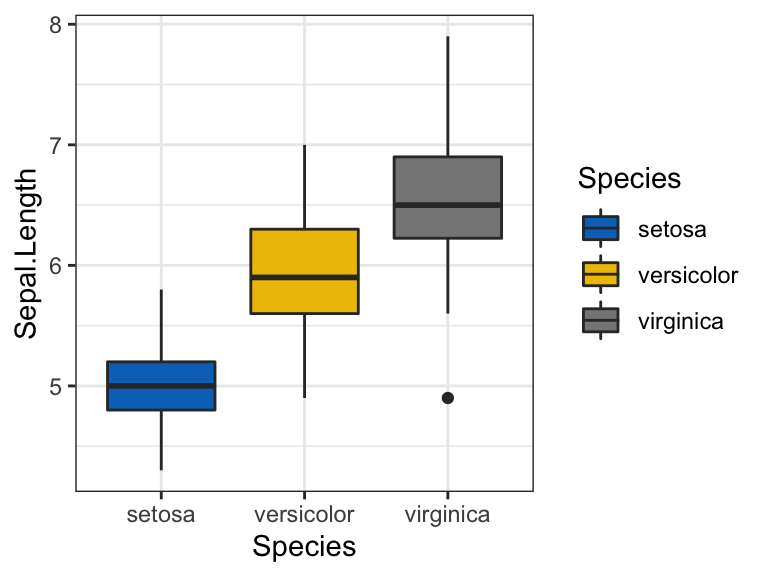
Read more at: ggsci color palettes
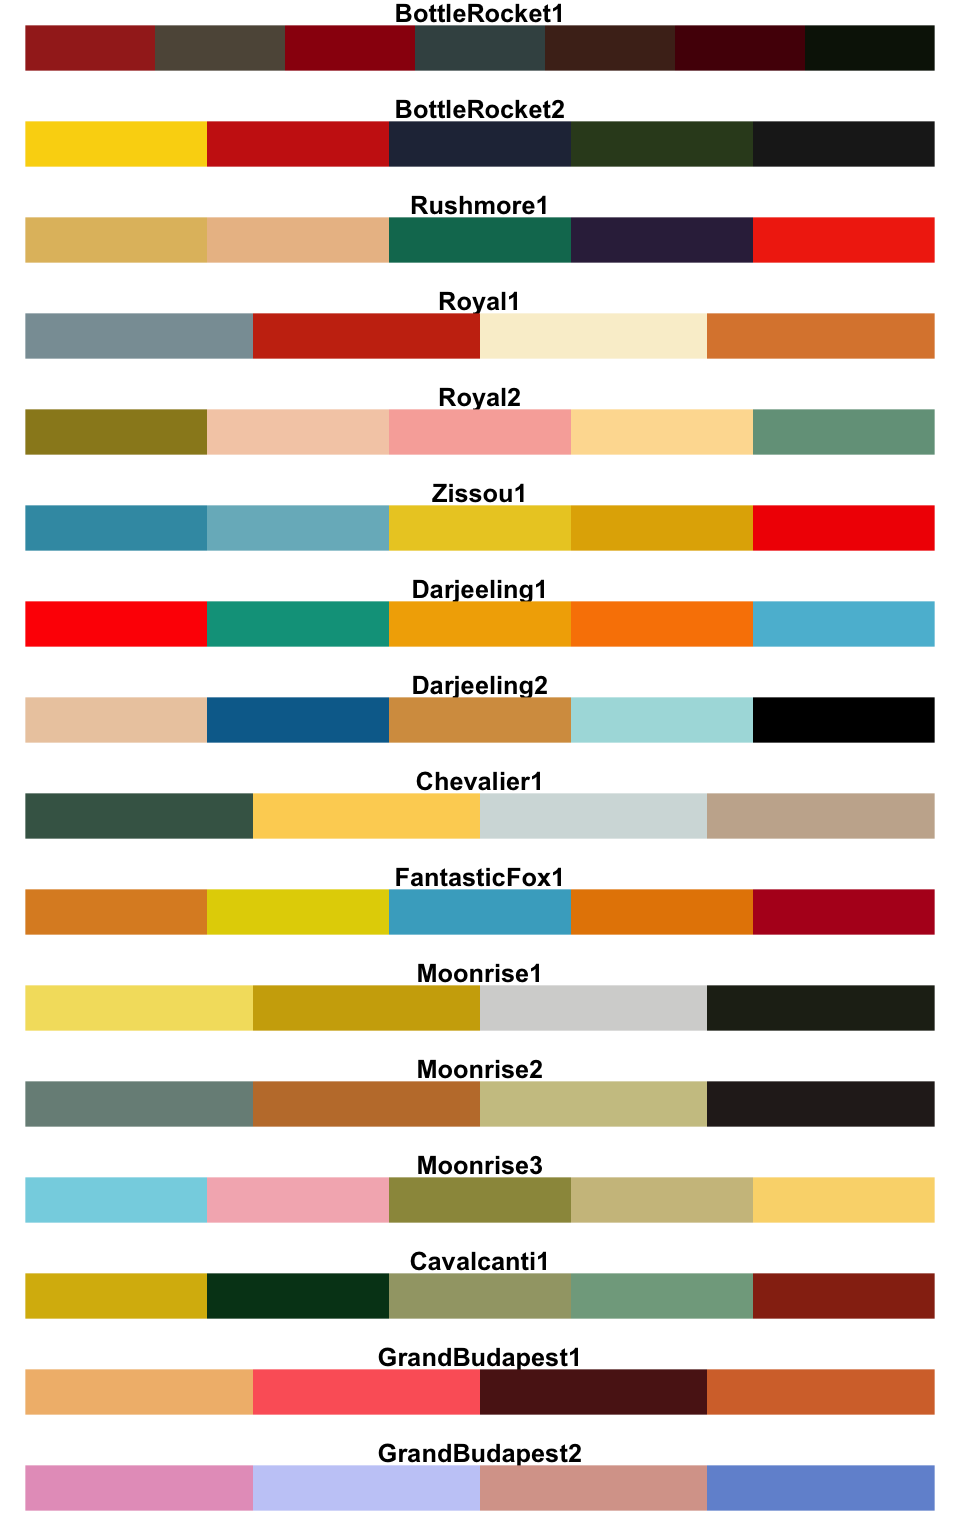
Wes Anderson color palettes
The corresponding R package contains 16 color palettes from Wes Anderson movies. The available color palettes are shown in the chart below :
- First, load the package as follow:
library("wesanderson")- Usage in R base plots
barplot(c(2, 5, 8), col = wes_palette("GrandBudapest1", n = 3))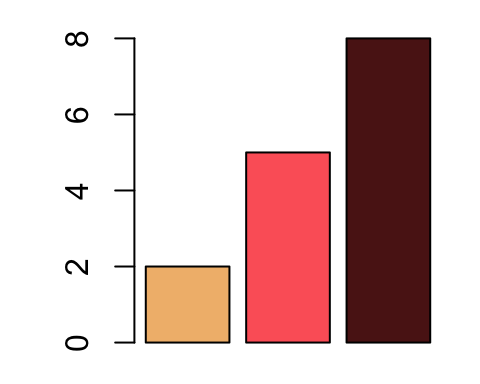
- Usage in ggplots:
ggplot(iris, aes(Species, Sepal.Length)) +
  geom_boxplot(aes(fill = Species)) +
  scale_fill_manual(values = wes_palette("GrandBudapest1", n = 3))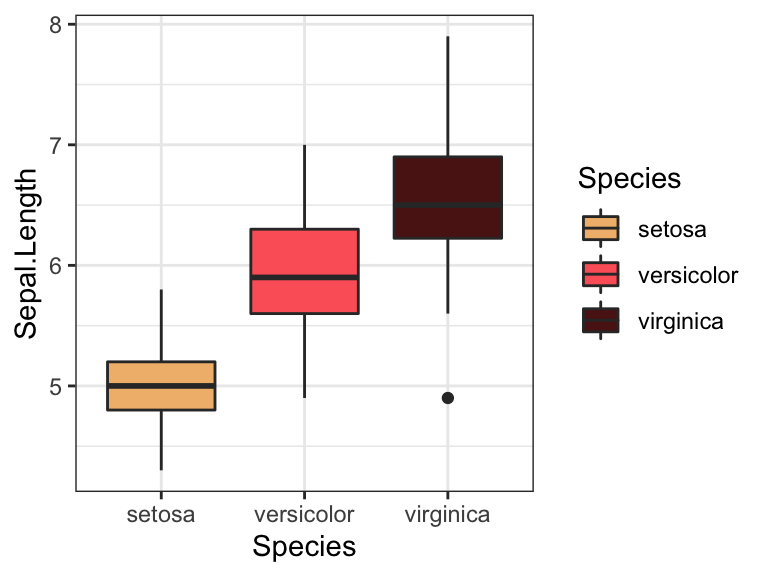
Learn more at: Top R Color Palettes to Know for Great Data Visualization
R base color palettes
There are 5 R base functions that can be used to generate a vector of n contiguous colors: rainbow(n), heat.colors(n), terrain.colors(n), topo.colors(n), and cm.colors(n).
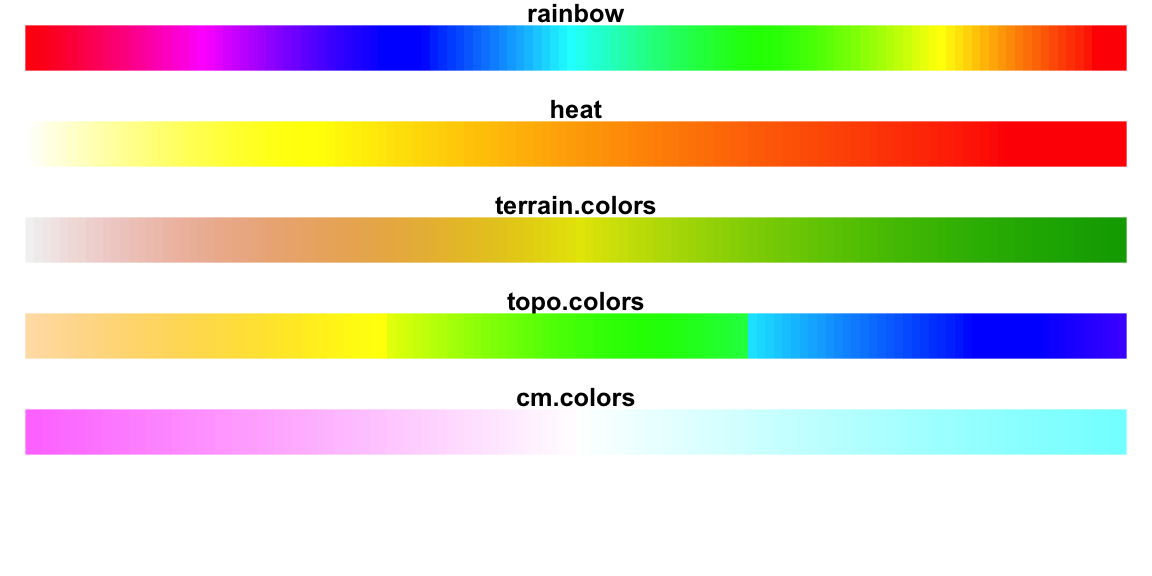
- Usage in R base plots:
barplot(1:5, col=rainbow(5))
# Use heat.colors
barplot(1:5, col=heat.colors(5))
# Use terrain.colors
barplot(1:5, col=terrain.colors(5))
# Use topo.colors
barplot(1:5, col=topo.colors(5))
# Use cm.colors
barplot(1:5, col=cm.colors(5))- Usage in ggplots:
ggplot(iris, aes(Species, Sepal.Length)) +
  geom_boxplot(aes(fill = Species)) +
  scale_fill_manual(values = rainbow(3))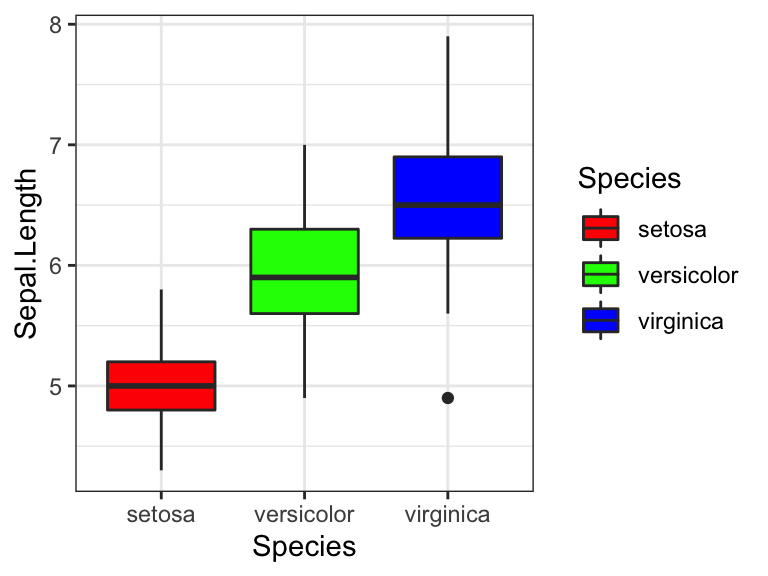
Conclusion
This article presents a list of R colors yu can choose to create plots using either the ggplot2 package or the R base functions.
Recommended for you
This section contains best data science and self-development resources to help you on your path.
Books - Data Science
Our Books
- Practical Guide to Cluster Analysis in R by A. Kassambara (Datanovia)
- Practical Guide To Principal Component Methods in R by A. Kassambara (Datanovia)
- Machine Learning Essentials: Practical Guide in R by A. Kassambara (Datanovia)
- R Graphics Essentials for Great Data Visualization by A. Kassambara (Datanovia)
- GGPlot2 Essentials for Great Data Visualization in R by A. Kassambara (Datanovia)
- Network Analysis and Visualization in R by A. Kassambara (Datanovia)
- Practical Statistics in R for Comparing Groups: Numerical Variables by A. Kassambara (Datanovia)
- Inter-Rater Reliability Essentials: Practical Guide in R by A. Kassambara (Datanovia)
Others
- R for Data Science: Import, Tidy, Transform, Visualize, and Model Data by Hadley Wickham & Garrett Grolemund
- Hands-On Machine Learning with Scikit-Learn, Keras, and TensorFlow: Concepts, Tools, and Techniques to Build Intelligent Systems by Aurelien Géron
- Practical Statistics for Data Scientists: 50 Essential Concepts by Peter Bruce & Andrew Bruce
- Hands-On Programming with R: Write Your Own Functions And Simulations by Garrett Grolemund & Hadley Wickham
- An Introduction to Statistical Learning: with Applications in R by Gareth James et al.
- Deep Learning with R by François Chollet & J.J. Allaire
- Deep Learning with Python by François Chollet
Version:
 Français


No Comments