T-Test Essentials: Definition, Formula and Calculation

T-Test Essentials: Definition, Formula and Calculation

T-Test Essentials: Definition, Formula and Calculation

Course description

The t-test can be defined as a statistical test used to compare two means. This guide provide multiple tutorials describing the different types of t-test, including:

  • one-sample t-tests. Compares one-sample mean to a know standard mean.
  • independent samples t-tests: Student’s t-test and Welch’s t-test. Compares two independent groups
  • paired samples t-test. Compares two related samples.

You will learn the t-test formula and how to:

  • Compute the different t-tests in R
  • Check t-test assumptions
  • Calculate and report t-test effect size using Cohen’s d.


Contents:

Related Book

Practical Statistics in R II - Comparing Groups: Numerical Variables

Prerequisites

Make sure you have installed the following R packages:

  • tidyverse for data manipulation and visualization
  • ggpubr for creating easily publication ready plots
  • rstatix provides pipe-friendly R functions for easy statistical analyses.
  • datarium: contains required data sets for this chapter.

Start by loading the following required packages:

library(tidyverse)
library(ggpubr)
library(rstatix)

Examples of R codes

Comparing two independent groups:

# Data preparation
data("genderweight", package = "datarium")
head(genderweight, 3)
## # A tibble: 3 x 3
##   id    group weight
##   <fct> <fct>  <dbl>
## 1 1     F       61.6
## 2 2     F       64.6
## 3 3     F       66.2
# Statistical test
stat.test <- genderweight %>% 
  t_test(weight ~ group) %>%
  add_significance()
stat.test
## # A tibble: 1 x 9
##   .y.    group1 group2    n1    n2 statistic    df        p p.signif
##   <chr>  <chr>  <chr>  <int> <int>     <dbl> <dbl>    <dbl> <chr>   
## 1 weight F      M         20    20     -20.8  26.9 4.30e-18 ****
# Visualization: 
# Create a box-plot
bxp <- ggboxplot(
  genderweight, x = "group", y = "weight", 
  ylab = "Weight", xlab = "Groups", add = "jitter"
  )
# Add p-value and significance levels
stat.test <- stat.test %>% add_xy_position(x = "group")
bxp + 
  stat_pvalue_manual(stat.test, tip.length = 0) +
  labs(subtitle = get_test_label(stat.test, detailed = TRUE))
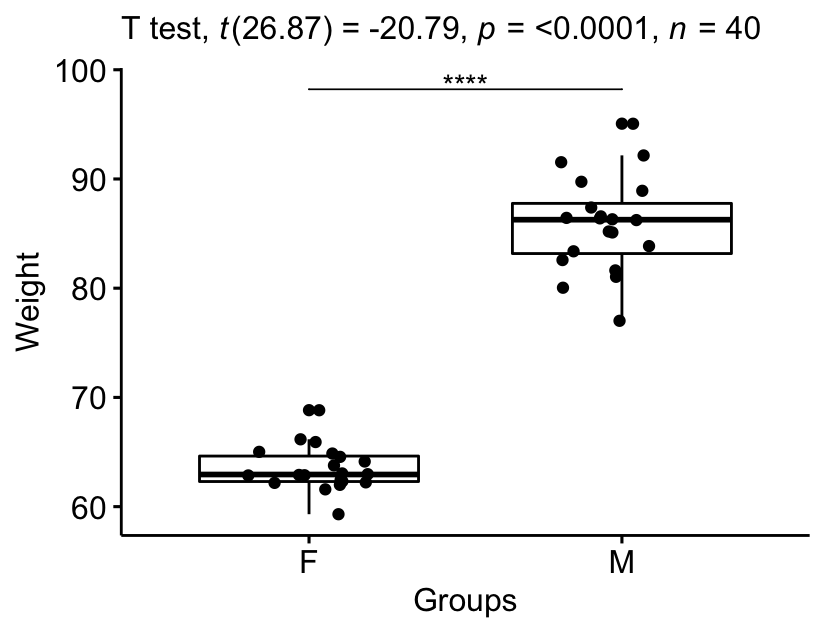


Version: Français

Lessons

  1. Describes the different types of t-test for comparing the means of groups. These include: one-sample t-tests, unpaired t-test and paired t-test.
    1. Describes the one-sample t-test, which is used to compare the mean of one sample to a known standard (or theoretical / hypothetical) mean. You will learn the formula, assumptions, calculation, visualization, effect size measure using the Cohen's d, interpretation and reporting in R.
    2. Describes the unpaired t-test, which is used to compare the mean of two independent groups. You will learn the formula, assumptions, calculation, visualization, effect size measure using the Cohen's d, interpretation and reporting in R. The Student's t-test and the Welch t-test are described.
      1. Describes the Student's t-test, which is used to compare the mean of two independent groups. You will learn the formula, assumptions, calculation, visualization, effect size measure using the Cohen's d, interpretation and reporting in R.
      2. Describes the Welch t-test, which is used to compare the mean of two independent groups. You will learn the formula, assumptions, calculation, visualization, effect size measure using the Cohen's d, interpretation and reporting in R.
    3. Describes the paired t-test, which is used to compare the mean of two related groups of samples. You will learn the formula, assumptions, calculation, visualization, effect size measure using the Cohen's d, interpretation and reporting in R.
  2. Describes how to compute the pairwise T-test in R between groups with corrections for multiple testing. The pairwise t-test consists of calculating multiple t-test between all possible combinations of groups. You will learn how to: 1) Calculate pairwise t-test for unpaired and paired groups; 2) Display the p-values on a boxplot.
  3. Describes the t-test assumptions and provides examples of R code to check whether the assumptions are met before calculating the t-test. You will learn the assumptions of the different types of t-test, including the one-sample t-test, independent t-test and paired t-test.

Comments ( 4 )

  • Hafsteinn Ragnarsson

    Fantastic lesson! I’m currently bingeing all of Alboukadel Kassambara’s lessons on this website. Really clear and concise.

    • Kassambara

      Thank you for your positive feedback, highly apprecited

  • Krzysztof Polowy

    Hi, I have just completed this first course on your website. What a fantastic work – simple, concise and clear, but most of all – with a workable expamles! I enoyed it very much and I’m sure to use many of your other courses right away!
    Thanks for all your good work!

    • Kassambara

      Thank you very much for the positive feed. I’m very happy that it was useful for you.

Give a comment

Want to post an issue with R? If yes, please make sure you have read this: How to Include Reproducible R Script Examples in Datanovia Comments

Teachers