This article shows how to change a ggplot theme background color and grid lines.
The default theme of a ggplot2 graph has a grey background color. You can easily and quickly change this to a white background color by using the theme functions, such as theme_bw(), theme_classic(), theme_minimal() or theme_light() (See ggplot2 themes gallery).
Another alternative is to modify directly the arguments panel.background and panel.grid in the function theme().
In this R graphics tutorial, you will learn how to:
- Change a ggplot background color using a custom color, say lightblue.
- Remove the default ggplot grey background and replace it with a blank background color.
- Remove panel border and background grid lines (minor and major grids).
- Create and save a ggplot with transparent background (i.e., a ggplot with no background).
- Create a ggplot with dark / black background color.
Contents:
Key gglot2 R functions
Key ggplot2 theme options to modify the plot panel and background:
theme(

  plot.background = element_rect(),    # Background of the entire plot

  panel.background = element_rect(),   # Background of plotting area
  panel.border = element_rect(),       # Border around plotting area.
                                       # fill argument should be NA

  panel.grid = element_line(),         # All grid lines
  panel.grid.major = element_line(),   # Major grid lines
  panel.grid.minor = element_line(),   # Minor grid lines

  panel.grid.major.x = element_line(), # Vertical major grid lines
  panel.grid.major.y = element_line(), # Horizontal major grid lines
  panel.grid.minor.x = element_line(), # Vertical minor grid lines
  panel.grid.minor.y = element_line()  # Vertical major grid lines
)
Arguments of the helper functons:
element_line(color, size, linetype). Modify grid lines color size and type.element_rect(fill, color, size, linetype). Modfify a rectangle element background fill, as well as, the border color, size and linetype.
To remove a particular panel grid, use element_blank() for the corresponding theme argument. For example to remove the major grid lines for the x axis, use this: p + theme(panel.grid.major.x = element_blank()).
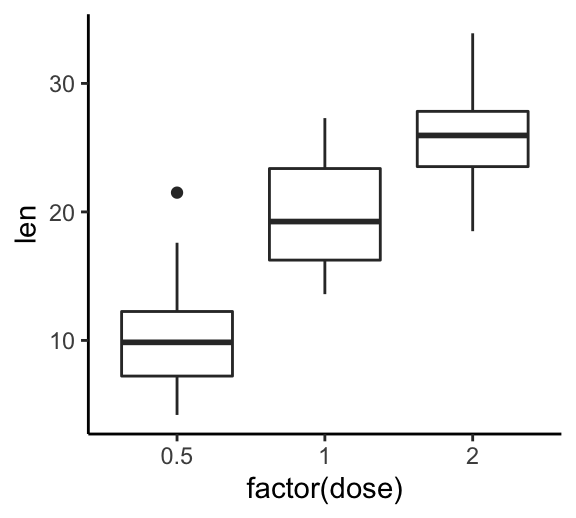
Create a basic ggplot
library(ggplot2)
p <- ggplot(ToothGrowth, aes(factor(dose), len)) +
  geom_boxplot()
p
Change background color and grid lines
- Change the panel background color
- Change the plot background color
# 1. Change plot panel background color to lightblue
# and the color of major/grid lines to white
p + theme(
panel.background = element_rect(fill = "#BFD5E3", colour = "#6D9EC1",
size = 2, linetype = "solid"),
panel.grid.major = element_line(size = 0.5, linetype = 'solid',
colour = "white"),
panel.grid.minor = element_line(size = 0.25, linetype = 'solid',
colour = "white")
)
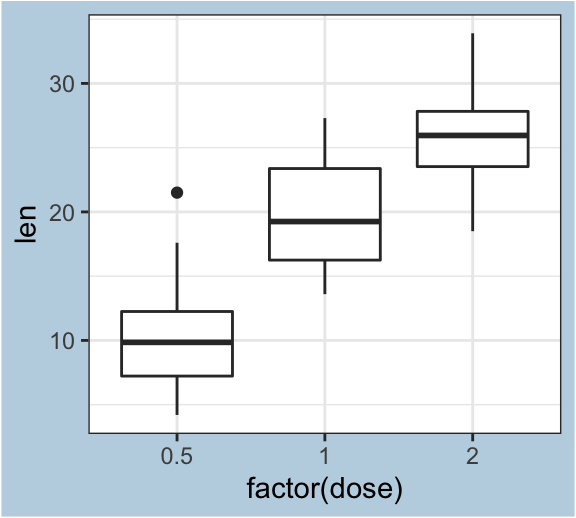
# 2. Change the plot background color (not the panel)
p + theme(plot.background = element_rect(fill = "#BFD5E3"))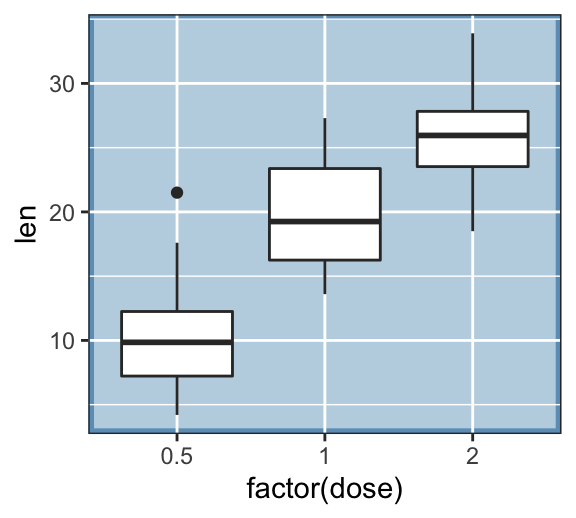
Remove panel border and background grid lines
R function to hide plot panel borders and gridlines: element_blank().
p + theme(
  # Hide panel borders and remove grid lines
  panel.border = element_blank(),
  panel.grid.major = element_blank(),
  panel.grid.minor = element_blank(),
  # Change axis line
  axis.line = element_line(colour = "black")
  )
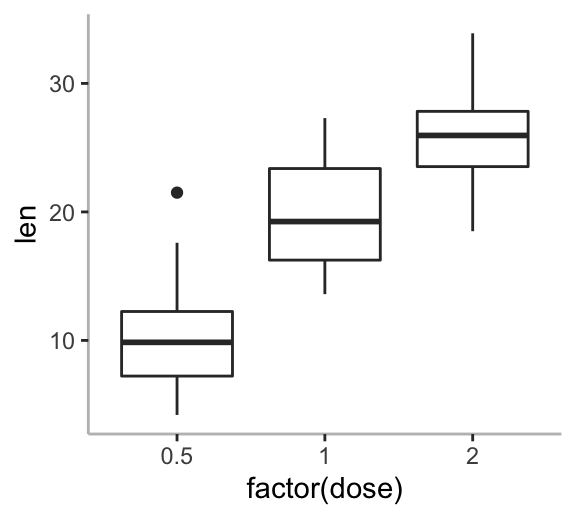
Remove grey background color
- Solution 1: Use the theme functions to get rid of the grey background (@ref(ggplot-themes-gallery).
p + theme_bw()  # Black and white theme

p + theme_classic() # Classic theme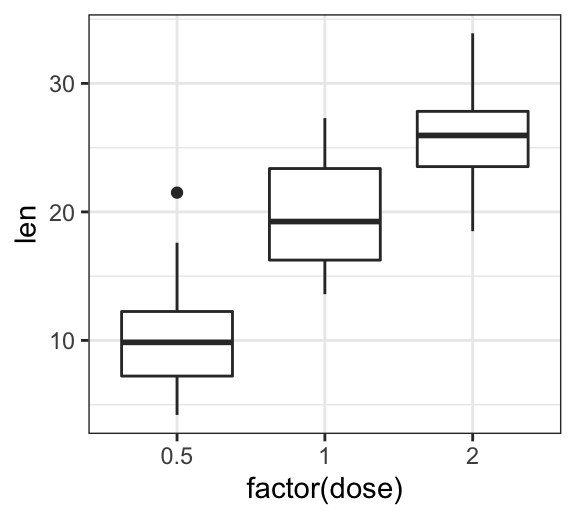
- Solution 2: Create, step-by-step, a ggplot with white background:
p + theme(
  # Remove panel border
  panel.border = element_blank(),
  # Remove panel grid lines
  panel.grid.major = element_blank(),
  panel.grid.minor = element_blank(),
  # Remove panel background
  panel.background = element_blank(),
  # Add axis line
  axis.line = element_line(colour = "grey")
  )
Make a ggplot with transparent background
In this section you will learn how to make and save a ggplot with transparent background.
- Solution 1: Use the function theme_transparent() [in ggpubr package]. First, install it with
install.packages("ggpubr"), then type this:
transparent.plot <- p + ggpubr::theme_transparent()
ggsave(filename = "transparent-background.png",
       plot = transparent.plot,
       bg = "transparent",
       width = 2, height = 1.5, units = "in")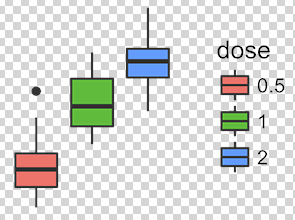
- Solution 2: Make a transparent background by starting from
theme_void():
p + theme_void() + # Empty theme without axis lines and texts
  theme(
    panel.background = element_rect(fill = "transparent", colour = NA),
    plot.background = element_rect(fill = "transparent", colour = NA),
    legend.background = element_rect(fill = "transparent", colour = NA),
    legend.box.background = element_rect(fill = "transparent", colour = NA)
  )
Create a ggplot with black background
Start by creating a simple scatter plot:
sp <- ggplot(iris, aes(Sepal.Length, Sepal.Width))+
  geom_point(aes(color = Species, shape = Species))+
  stat_smooth(aes(color = Species, fill = Species),
              method = "lm", alpha = 0.2)+
  scale_color_manual(values = c("#E4F00A", "white", "#22FF00")) +
  scale_fill_manual(values = c("#E4F00A", "white", "#22FF00"))
Use the dark theme function - theme_dark():
sp + theme_dark() 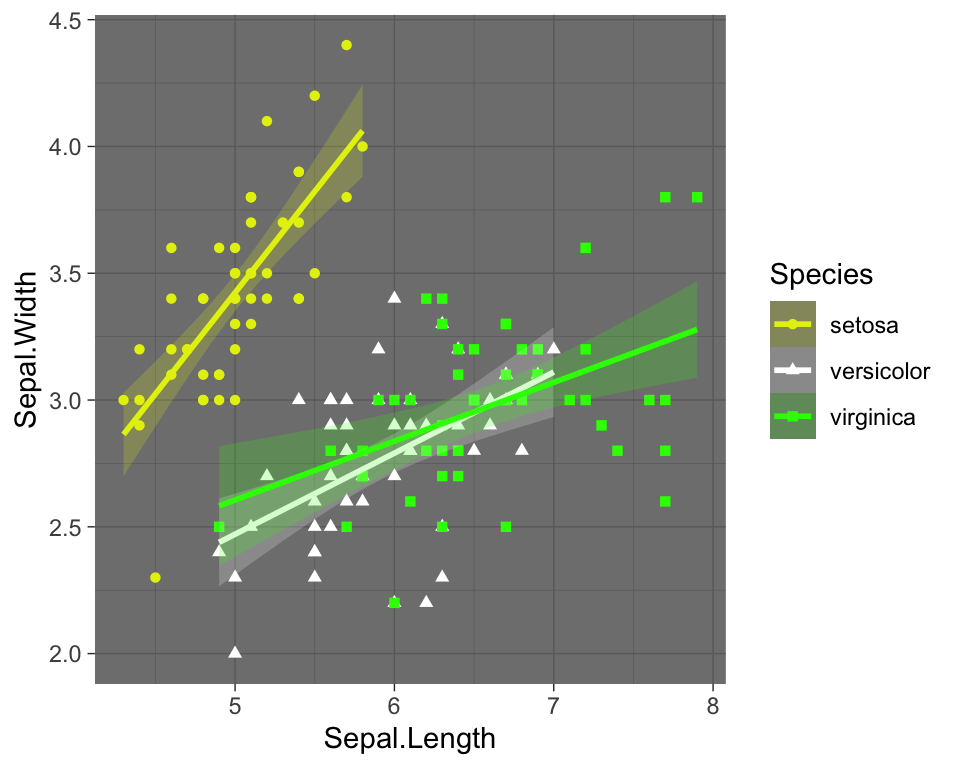
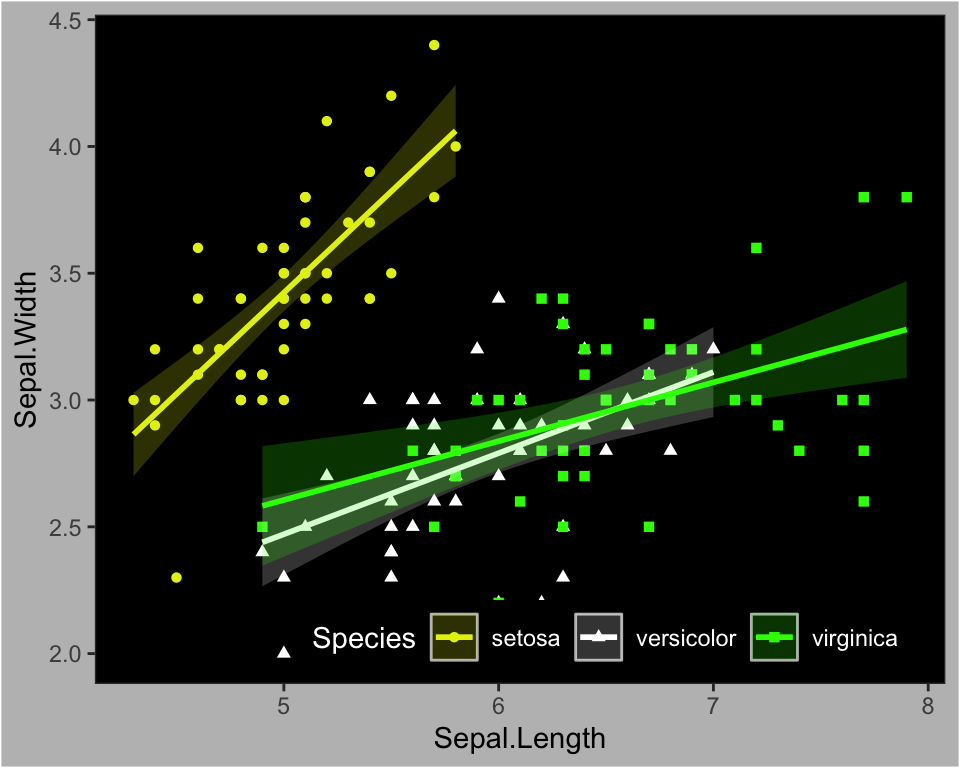
Create a ggplot with a black background:
sp + theme(
  # get rid of panel grids
  panel.grid.major = element_blank(),
  panel.grid.minor = element_blank(),
  # Change plot and panel background
  plot.background=element_rect(fill = "gray"),
  panel.background = element_rect(fill = 'black'),
  # Change legend
  legend.position = c(0.6, 0.07),
  legend.direction = "horizontal",
  legend.background = element_rect(fill = "black", color = NA),
  legend.key = element_rect(color = "gray", fill = "black"),
  legend.title = element_text(color = "white"),
  legend.text = element_text(color = "white")
  )
Conclusion
This article shows how to change a ggplot theme background color and grid lines. The essentials are summarized below:
- Create an example of ggplot:
library(ggplot2)
p <- ggplot(ToothGrowth, aes(factor(dose), len)) +
  geom_boxplot()
p- Change ggplot background color:
- use the standard ggplot2 themes (theme_classic(), theme_bw(), theme_minmal(), theme_light(), etc)
- or, edit the theme function as follow.
# Create a ggplot with white background
p + theme(
  plot.background = element_rect(fill = "white"),
  panel.background = element_rect(fill = "white"),
  axis.line.x = element_line(color = "grey")
)- Create a ggplot with transparent background. The easiest solution is to use the theme_transparent() function [in ggpubr]
p + ggpubr::theme_transparent()Recommended for you
This section contains best data science and self-development resources to help you on your path.
Books - Data Science
Our Books
- Practical Guide to Cluster Analysis in R by A. Kassambara (Datanovia)
- Practical Guide To Principal Component Methods in R by A. Kassambara (Datanovia)
- Machine Learning Essentials: Practical Guide in R by A. Kassambara (Datanovia)
- R Graphics Essentials for Great Data Visualization by A. Kassambara (Datanovia)
- GGPlot2 Essentials for Great Data Visualization in R by A. Kassambara (Datanovia)
- Network Analysis and Visualization in R by A. Kassambara (Datanovia)
- Practical Statistics in R for Comparing Groups: Numerical Variables by A. Kassambara (Datanovia)
- Inter-Rater Reliability Essentials: Practical Guide in R by A. Kassambara (Datanovia)
Others
- R for Data Science: Import, Tidy, Transform, Visualize, and Model Data by Hadley Wickham & Garrett Grolemund
- Hands-On Machine Learning with Scikit-Learn, Keras, and TensorFlow: Concepts, Tools, and Techniques to Build Intelligent Systems by Aurelien Géron
- Practical Statistics for Data Scientists: 50 Essential Concepts by Peter Bruce & Andrew Bruce
- Hands-On Programming with R: Write Your Own Functions And Simulations by Garrett Grolemund & Hadley Wickham
- An Introduction to Statistical Learning: with Applications in R by Gareth James et al.
- Deep Learning with R by François Chollet & J.J. Allaire
- Deep Learning with Python by François Chollet
Version:
 Français


Hi, thanks a lot for these very helpful tips! I am looking for a solution to also change the border color of the entire plot, not just the panel. You shared the code how to change color of the border of the panel with ‘panel.border = element_blank()’. Is there something similar for plot.border? Thanks a lot! Martin