
In this article, you will learn how to set ggplot breaks for continuous x and y axes. The function scale_x_continuous() and scale_y_continuous() can be used for ggplot axis breaks settings.
Related Book
GGPlot2 Essentials for Great Data Visualization in RPrerequisites
Load the ggplot2 package and set the theme function theme_classic() as the default theme:
library(ggplot2)
theme_set(
  theme_classic() +
    theme(legend.position = "top")
  )
Basic scatter plots
sp <- ggplot(cars, aes(x = speed, y = dist)) +
  geom_point()
sp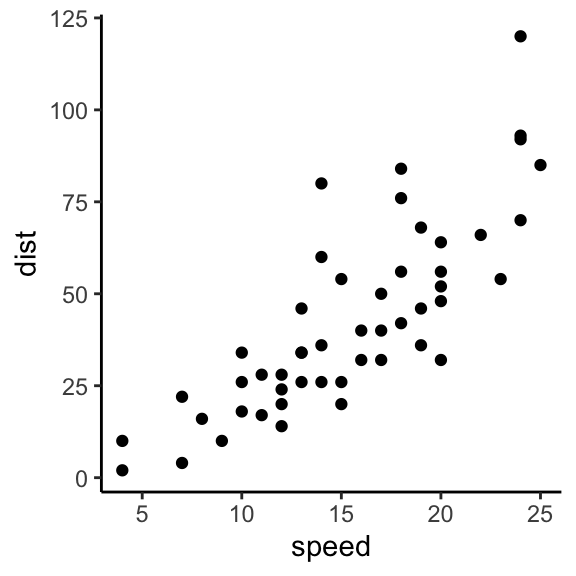
Change axis ticks break interval
# Break y axis by a specified value
# a tick mark is shown on every 50
sp + scale_y_continuous(breaks=seq(0, 150, by = 50))
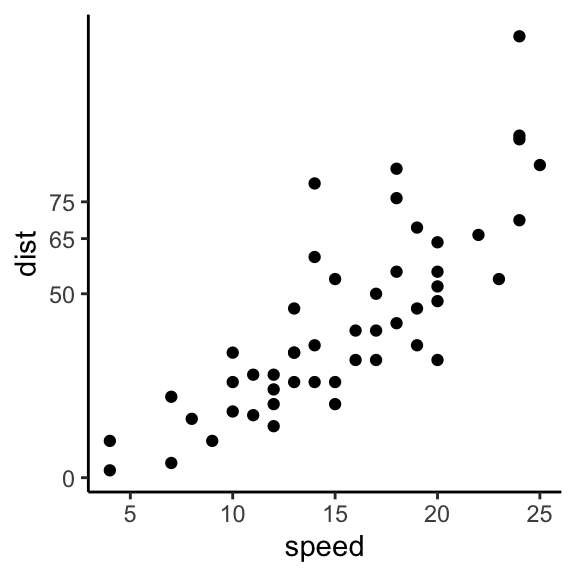
# Tick marks can be spaced randomly
sp + scale_y_continuous(breaks=c(0, 50, 65, 75, 150))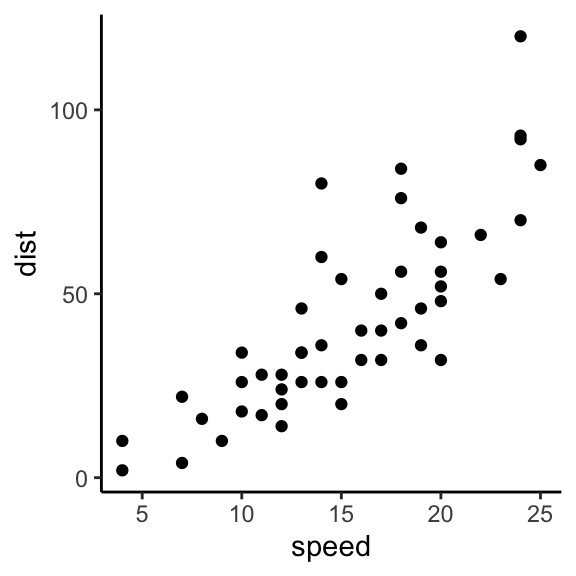
Remove breaks
# Remove y tick mark labels and grid lines
sp + scale_y_continuous(breaks=NULL)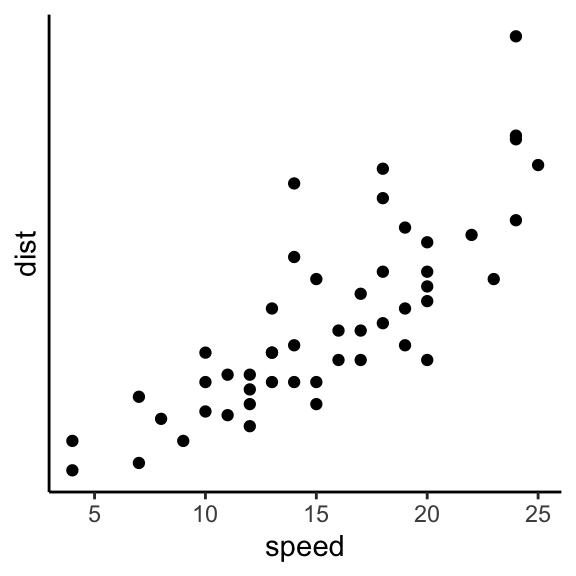
Recommended for you
This section contains best data science and self-development resources to help you on your path.
Books - Data Science
Our Books
- Practical Guide to Cluster Analysis in R by A. Kassambara (Datanovia)
- Practical Guide To Principal Component Methods in R by A. Kassambara (Datanovia)
- Machine Learning Essentials: Practical Guide in R by A. Kassambara (Datanovia)
- R Graphics Essentials for Great Data Visualization by A. Kassambara (Datanovia)
- GGPlot2 Essentials for Great Data Visualization in R by A. Kassambara (Datanovia)
- Network Analysis and Visualization in R by A. Kassambara (Datanovia)
- Practical Statistics in R for Comparing Groups: Numerical Variables by A. Kassambara (Datanovia)
- Inter-Rater Reliability Essentials: Practical Guide in R by A. Kassambara (Datanovia)
Others
- R for Data Science: Import, Tidy, Transform, Visualize, and Model Data by Hadley Wickham & Garrett Grolemund
- Hands-On Machine Learning with Scikit-Learn, Keras, and TensorFlow: Concepts, Tools, and Techniques to Build Intelligent Systems by Aurelien Géron
- Practical Statistics for Data Scientists: 50 Essential Concepts by Peter Bruce & Andrew Bruce
- Hands-On Programming with R: Write Your Own Functions And Simulations by Garrett Grolemund & Hadley Wickham
- An Introduction to Statistical Learning: with Applications in R by Gareth James et al.
- Deep Learning with R by François Chollet & J.J. Allaire
- Deep Learning with Python by François Chollet
Version:
 Français


No Comments