This article describes how to compute pairwise T-test in R between groups with corrections for multiple testing. The pairwise t-test consists of calculating multiple t-test between all possible combinations of groups.
You will learn how to:
- Calculate pairwise t-test for unpaired and paired groups
- Display the p-values on a boxplot.
Contents:
Related Book
Practical Statistics in R II - Comparing Groups: Numerical VariablesPrerequisites
Make sure you have the following R packages:
tidyversefor data manipulation and visualizationggpubrfor creating easily publication ready plotsrstatixprovides pipe-friendly R functions for easy statistical analysesdatarium: contains required data sets for this chapter
Load required R packages:
library(tidyverse)
library(ggpubr)
library(rstatix)
Pairwise t-test for independent groups
This section shows how to perform multiple independent t-tests between groups.
# Load and inspect the demo data
data("PlantGrowth")
set.seed(1234)
PlantGrowth %>% sample_n_by(group, size = 2)
## # A tibble: 6 x 2
## weight group
## <dbl> <fct>
## 1 5.58 ctrl
## 2 4.61 ctrl
## 3 6.03 trt1
## 4 3.83 trt1
## 5 5.8 trt2
## 6 5.29 trt2# Pairwise comparisons
pwc <- PlantGrowth %>%
pairwise_t_test(
weight ~ group, pool.sd = FALSE,
p.adjust.method = "bonferroni"
)
pwc## # A tibble: 3 x 10
## .y. group1 group2 n1 n2 statistic df p p.adj p.adj.signif
## * <chr> <chr> <chr> <int> <int> <dbl> <dbl> <dbl> <dbl> <chr>
## 1 weight ctrl trt1 10 10 1.19 16.5 0.25 0.75 ns
## 2 weight ctrl trt2 10 10 -2.13 16.8 0.048 0.144 ns
## 3 weight trt1 trt2 10 10 -3.01 14.1 0.009 0.028 *# Visualization: box plots with p-values
pwc <- pwc %>% add_xy_position(x = "group", step.increase = 1)
ggboxplot(PlantGrowth, x = "group", y = "weight") +
stat_pvalue_manual(pwc, hide.ns = TRUE) 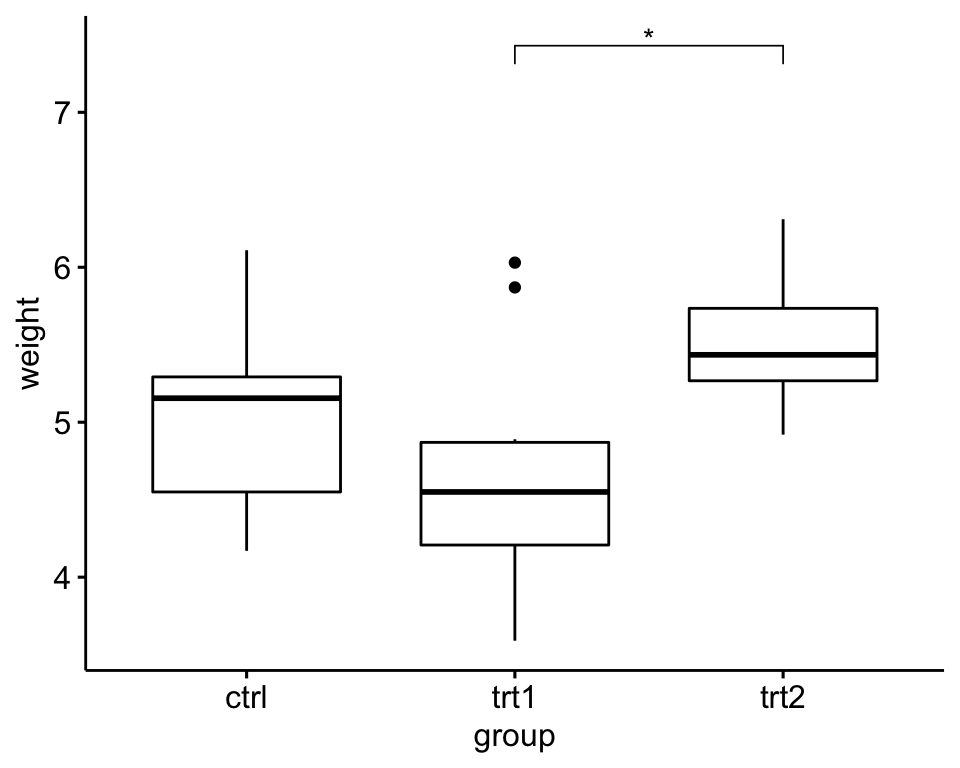
Pairwise t-test for paired groups
This section shows how to perform multiple paired t-tests between groups. We’ll use the self-esteem score dataset measured over three time points. The data is available in the datarium package.
# Data preparation: Wide format
data("selfesteem", package = "datarium")
head(selfesteem, 3)
## # A tibble: 3 x 4
## id t1 t2 t3
## <int> <dbl> <dbl> <dbl>
## 1 1 4.01 5.18 7.11
## 2 2 2.56 6.91 6.31
## 3 3 3.24 4.44 9.78# Gather columns t1, t2 and t3 into long format
# Convert id and time into factor variables
selfesteem <- selfesteem %>%
gather(key = "time", value = "score", t1, t2, t3) %>%
convert_as_factor(id, time)
head(selfesteem, 3)## # A tibble: 3 x 3
## id time score
## <fct> <fct> <dbl>
## 1 1 t1 4.01
## 2 2 t1 2.56
## 3 3 t1 3.24# Pairwise comparisons
pwc <- selfesteem %>%
pairwise_t_test(
score ~ time, paired = TRUE,
p.adjust.method = "bonferroni"
)
pwc## # A tibble: 3 x 10
## .y. group1 group2 n1 n2 statistic df p p.adj p.adj.signif
## * <chr> <chr> <chr> <int> <int> <dbl> <dbl> <dbl> <dbl> <chr>
## 1 score t1 t2 10 10 -4.97 9 0.000772 0.002 **
## 2 score t1 t3 10 10 -13.2 9 0.000000334 0.000001 ****
## 3 score t2 t3 10 10 -4.87 9 0.000886 0.003 **# Visualization: box plots with p-values
pwc <- pwc %>% add_xy_position(x = "time")
ggboxplot(selfesteem, x = "time", y = "score", add = "point") +
stat_pvalue_manual(pwc)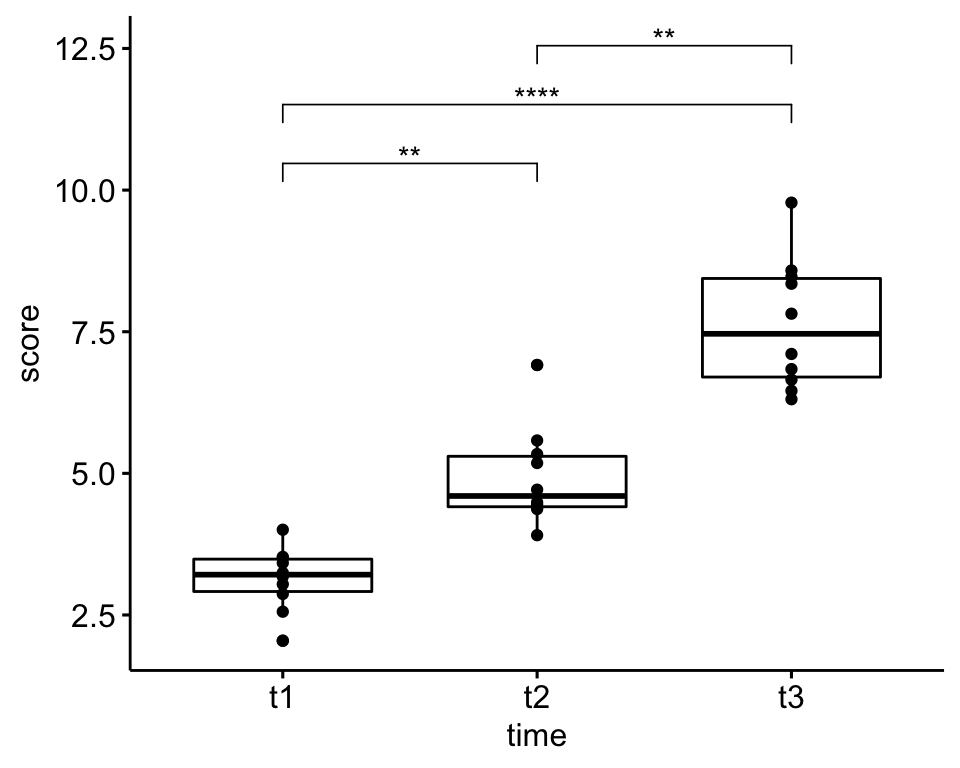
Recommended for you
This section contains best data science and self-development resources to help you on your path.
Books - Data Science
Our Books
- Practical Guide to Cluster Analysis in R by A. Kassambara (Datanovia)
- Practical Guide To Principal Component Methods in R by A. Kassambara (Datanovia)
- Machine Learning Essentials: Practical Guide in R by A. Kassambara (Datanovia)
- R Graphics Essentials for Great Data Visualization by A. Kassambara (Datanovia)
- GGPlot2 Essentials for Great Data Visualization in R by A. Kassambara (Datanovia)
- Network Analysis and Visualization in R by A. Kassambara (Datanovia)
- Practical Statistics in R for Comparing Groups: Numerical Variables by A. Kassambara (Datanovia)
- Inter-Rater Reliability Essentials: Practical Guide in R by A. Kassambara (Datanovia)
Others
- R for Data Science: Import, Tidy, Transform, Visualize, and Model Data by Hadley Wickham & Garrett Grolemund
- Hands-On Machine Learning with Scikit-Learn, Keras, and TensorFlow: Concepts, Tools, and Techniques to Build Intelligent Systems by Aurelien Géron
- Practical Statistics for Data Scientists: 50 Essential Concepts by Peter Bruce & Andrew Bruce
- Hands-On Programming with R: Write Your Own Functions And Simulations by Garrett Grolemund & Hadley Wickham
- An Introduction to Statistical Learning: with Applications in R by Gareth James et al.
- Deep Learning with R by François Chollet & J.J. Allaire
- Deep Learning with Python by François Chollet
Version:
 Français

what are the assumptions for the pairwise test?
How is the Result of the pairwise t-Test for independent groups reportet?
Like this?
(t(63.4)= 1.34; p.adj. > 0.05†)
Is it possible to have uneven df?
ggpubr doesn’t work for me. Seems to be not compatible with ggplot e.g. Quite tricky, I had to reinstall the package “rlang” to get ggplot working again.
And wasn’t able to use ggpubr.
Error message similar to this one: https://stackoverflow.com/questions/66782751/namespace-rlang-0-4-5-is-being-loaded-but-0-4-10-is-required
Generaly: Many thanks for developing and maintaining these packages!