ADTTE: Build the Time-to-Event ADaM Dataset in R with admiral
Derive a CDISC-conformant time-to-event dataset — PARAMCD, AVAL, CNSR — with admiral’s derive_param_tte(), then run a Kaplan-Meier analysis on it
Pharma & Clinical
A complete, runnable tutorial for the ADTTE time-to-event ADaM dataset. Learn the BDS time-to-event structure (PARAMCD/PARAM, AVAL as the time, the CNSR 0/1 censoring convention, STARTDT to ADT), derive a conformant ADTTE in R from a pre-built ADSL and event/censor sources with admiral’s derive_param_tte(), and analyze it with a Kaplan-Meier curve, median survival, and a log-rank test on public pharmaverse data.
TipKey takeaways
- ADTTE is the ADaM dataset for survival endpoints — overall survival, progression-free survival, time to first adverse event. It follows the Basic Data Structure (BDS): one row per subject per parameter.
- Three variables carry the analysis.
AVALis the time to the event,CNSRis the censoring flag (CDISC convention:CNSR = 0= event happened, a positive integer = censored), andSTARTDT→ADTare the clock’s start and stop dates. - admiral derives it declaratively. You describe what counts as an event with
event_source()and what counts as censoring withcensor_source(), thenderive_param_tte()picks the earliest event (or the latest censor) per subject — no hand-rolledcase_when()date logic. derive_vars_duration()computesAVALfromSTARTDTtoADTin days; a final merge brings treatment and covariates back from ADSL. The result is submission-shaped and analysis-ready.- The payoff is a survival analysis. Feed
Surv(AVAL, 1 - CNSR)straight intosurvfit()for a Kaplan-Meier curve, median time-to-event, and a log-rank test — the dataset is built for it.
Introduction
A trial’s headline result is often a time-to-event number: median overall survival of 18.7 months, a hazard ratio of 0.74 for progression-free survival. Before any of that reaches a table or a Kaplan-Meier curve, someone has to build the ADTTE dataset — the analysis-ready ADaM (Analysis Data Model) dataset that holds, for every subject, how long until the event and whether the event actually happened or the subject was censored.
ADTTE trips up newcomers because it encodes a clinical question as a precise data structure. When does the clock start? What event stops it? What if no event ever occurs? This lesson answers all three by building a conformant ADTTE in R with admiral, the pharmaverse package for ADaM derivation, and then analyzing it with the survival stack. We work on public pharmaverse example data, so every line runs as-is.
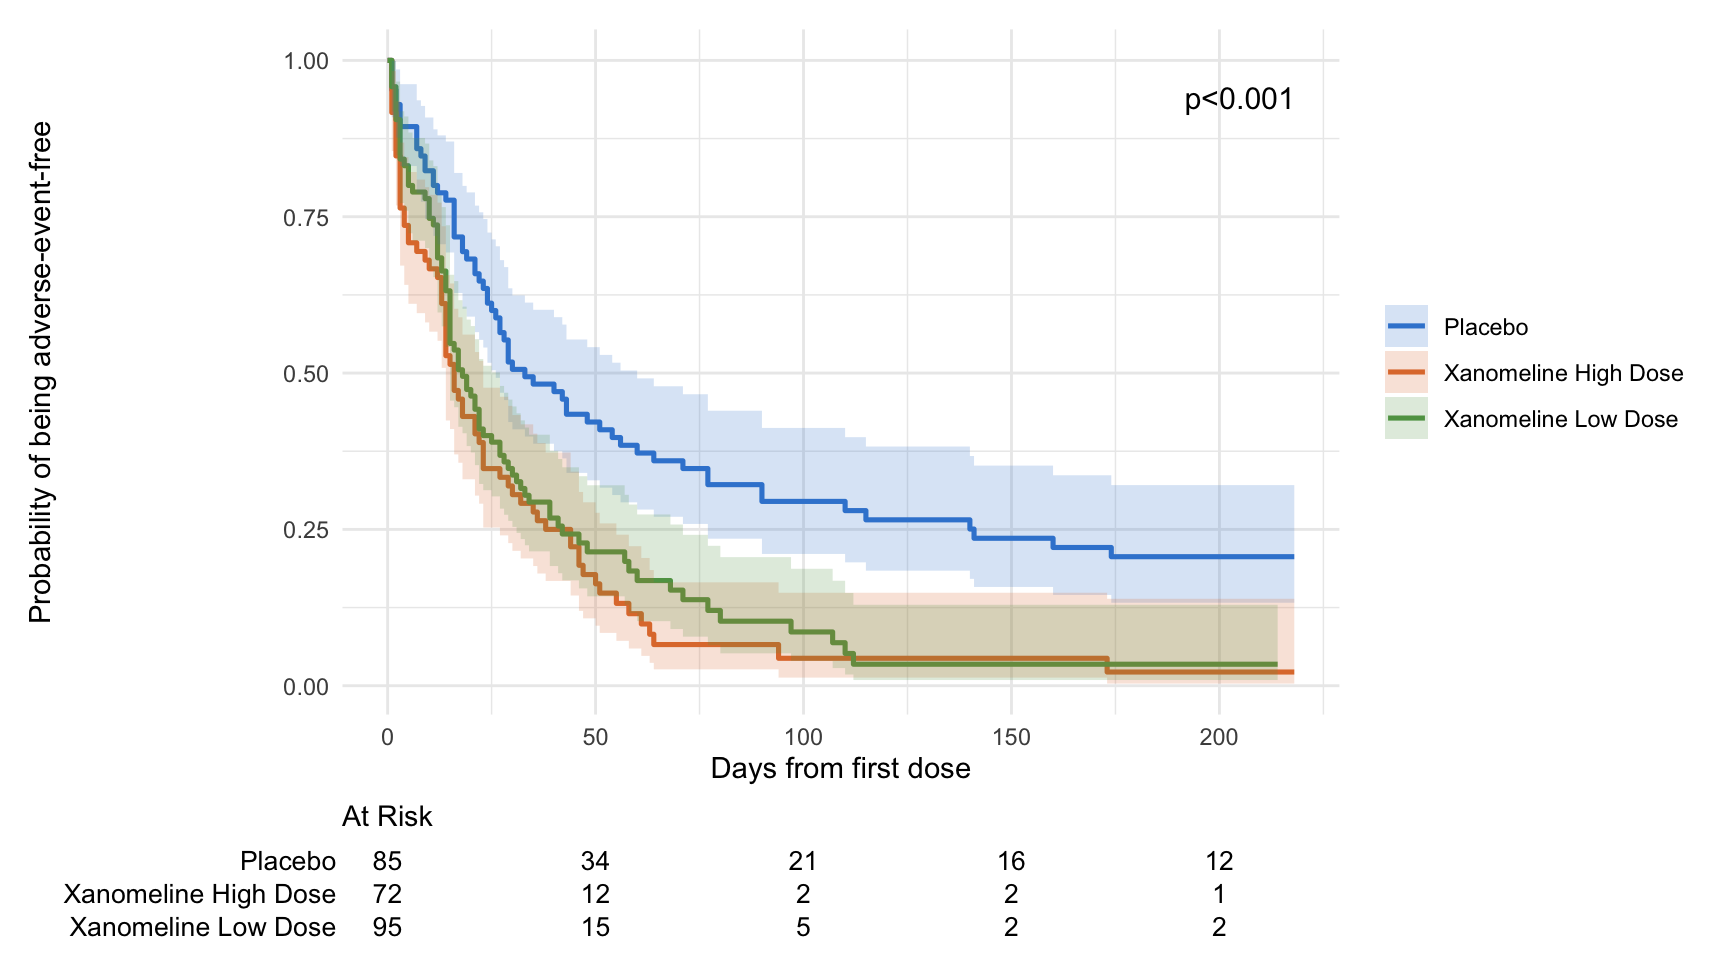
Here is where we are headed — a publication-ready Kaplan-Meier curve built directly from the ADTTE we derive:
This lesson assumes you have met the CDISC (Clinical Data Interchange Standards Consortium) pipeline already — if “ADaM”, “BDS”, or “SDTM” are new, start with the CDISC standards, which maps where ADTTE sits. Coming from SAS? The SAS-to-R map explains why admiral plays the role of a validated derivation macro library.
What ADTTE is
ADTTE is a Basic Data Structure (BDS) dataset, the same vertical, one-row-per-parameter shape used by ADLB and ADVS — but specialized for time-to-event analysis. Each row answers one question for one subject and one endpoint: from the origin date, how long until the event, and did it occur? The CDISC ADaM standard defines the structure (its Basic Data Structure for Time-to-Event Analyses document is the normative reference), and admiral implements it.
A handful of variables do the work. These are the load-bearing ADTTE columns:
| Variable | Label | What it holds |
|---|---|---|
PARAMCD |
Parameter Code | The endpoint identifier — OS, PFS, TTAE. One value per analysis. |
PARAM |
Parameter | The human-readable endpoint, e.g. Time to First Adverse Event. |
STARTDT |
Time-to-Event Origin Date | The clock start — usually first dose (TRTSDT) or randomization. |
ADT |
Analysis Date | The clock stop — the event date, or the censoring date if no event. |
AVAL |
Analysis Value | The time to event: the duration from STARTDT to ADT. |
AVALU |
Analysis Value Unit | The unit of AVAL — DAYS, MONTHS, YEARS. |
CNSR |
Censor | 0 = the event occurred; a positive integer = censored (no event observed). |
EVNTDESC |
Event or Censoring Description | Why this row is an event or a censor (traceability). |
SRCDOM / SRCVAR |
Source Domain / Variable | Where ADT came from — the audit trail back to the raw data. |
Two conventions catch people out, so fix them now:
CNSRis “backwards” from intuition.CNSR = 0means the event happened; a positive value means censored. CDISC strongly recommendsCNSR = 0for events and positive integers for censorings, and admiral enforces it. That is why every survival call below usesSurv(AVAL, 1 - CNSR)— flippingCNSRback to the standard “1 = event” status thesurvivalpackage expects.AVALis a duration, not a date.STARTDTandADTare dates;AVALis the number of time units between them. You derive it from the two dates, you do not store a date in it.
The clinical scenario this lesson uses is time to first adverse event — for every subject, how many days from first dose until their first treatment-emergent adverse event, censored at end of treatment for those who had none. The mechanics are identical for overall survival (event = death) or progression-free survival (event = progression or death); we show that variation at the end.
The source data
admiral builds ADTTE from a pre-built ADSL (one row per subject — the demographics and treatment backbone) plus the event and censoring sources you choose. We use the CDISC pilot example data shipped in pharmaverseadam and pharmaversesdtm — synthetic, license-free data designed for exactly this.
library(admiral)
library(dplyr)
library(pharmaversesdtm)
library(pharmaverseadam)
library(lubridate)

# ADSL — one row per subject, the demographics + treatment backbone
adsl <- pharmaverseadam::adsl

# AE — the raw adverse-event domain that will supply our event dates.
# convert_blanks_to_na() turns SDTM's empty strings "" into proper NA.
ae <- pharmaversesdtm::ae %>% convert_blanks_to_na()

adsl %>%
  select(USUBJID, TRT01A, TRTSDT, TRTEDT, AGE, SEX) %>%
  head(5)
# A tibble: 5 × 6
USUBJID TRT01A TRTSDT TRTEDT AGE SEX
<chr> <chr> <date> <date> <dbl> <chr>
1 01-701-1015 Placebo 2014-01-02 2014-07-02 63 F
2 01-701-1023 Placebo 2012-08-05 2012-09-01 64 M
3 01-701-1028 Xanomeline High Dose 2013-07-19 2014-01-14 71 M
4 01-701-1033 Xanomeline Low Dose 2014-03-18 2014-03-31 74 M
5 01-701-1034 Xanomeline High Dose 2014-07-01 2014-12-30 77 F ADSL gives us TRTSDT (first-dose date — our clock start) and TRTEDT (last-dose date — the basis for censoring). The AE domain gives us adverse-event onset dates in AESTDTC. Everything else is derived.
Prepare the event source
The event is “first treatment-emergent adverse event,” so the AE dates need two things: a real R date (AESTDTC is an ISO character string, possibly partial), and a treatment-emergent flag so we only count AEs that started on or after first dose. admiral’s derive_vars_dt() imputes and converts the date; a simple flag handles emergence.
adae <- ae %>%
  # bring the treatment dates from ADSL onto each AE record
  derive_vars_merged(
    dataset_add = adsl,
    new_vars = exprs(TRTSDT, TRTEDT),
    by_vars = exprs(STUDYID, USUBJID)
  ) %>%
  # convert AESTDTC -> ASTDT, imputing a missing day/month to the first ("M")
  derive_vars_dt(new_vars_prefix = "AST", dtc = AESTDTC, highest_imputation = "M") %>%
  # treatment-emergent: started on/after first dose, up to 30 days after last dose
  mutate(TRTEMFL = if_else(ASTDT >= TRTSDT & ASTDT <= TRTEDT + days(30), "Y", NA_character_))

adae %>%
  select(USUBJID, AESTDTC, ASTDT, TRTSDT, TRTEMFL) %>%
  head(5)
# A tibble: 5 × 5
USUBJID AESTDTC ASTDT TRTSDT TRTEMFL
<chr> <chr> <date> <date> <chr>
1 01-701-1015 2014-01-03 2014-01-03 2014-01-02 Y
2 01-701-1015 2014-01-03 2014-01-03 2014-01-02 Y
3 01-701-1015 2014-01-09 2014-01-09 2014-01-02 Y
4 01-701-1023 2012-08-26 2012-08-26 2012-08-05 Y
5 01-701-1023 2012-08-07 2012-08-07 2012-08-05 Y derive_vars_dt() is doing the unglamorous but critical work: a partial date like 2014-01 becomes 2014-01-01 (imputed), and the result lands in the new ASTDT column. TRTEMFL = "Y" marks the AEs that count. We will feed only those to the derivation.
Describe events and censoring
This is admiral’s core idea, and where it diverges from hand-written date logic. You do not compute the time yourself. You declare what an event is and what a censor is, as objects, and let derive_param_tte() resolve them.
# EVENT: the first adverse event. order = AESEQ breaks ties on the same date.
ttae <- event_source(
  dataset_name = "ae",
  date = ASTDT,
  order = exprs(AESEQ),
  set_values_to = exprs(
    EVNTDESC = "ADVERSE EVENT",
    SRCDOM   = "ADAE",
    SRCVAR   = "ASTDT"
  )
)

# CENSOR: subjects with no AE are censored at end of treatment + 30 days.
eot <- censor_source(
  dataset_name = "adsl",
  date = TRTEDT + days(30),
  set_values_to = exprs(
    EVNTDESC = "END OF TREATMENT",
    SRCDOM   = "ADSL",
    SRCVAR   = "TRTEDT"
  )
)
Read these as sentences. The event is the earliest ASTDT in the AE data; record that it was an adverse event from ADAE. Censoring happens at last dose plus 30 days from ADSL. The set_values_to blocks write the traceability variables (EVNTDESC, SRCDOM, SRCVAR) so the finished dataset documents why each row is an event or a censor — exactly what a reviewer wants to audit. censor_source() defaults its CNSR to 1; event_source() always sets CNSR = 0.
Derive the ADTTE parameter
Now hand the sources to derive_param_tte(). For each subject it finds the earliest qualifying event; if there is none, it takes the latest censor. It writes one row per subject with STARTDT, ADT, CNSR, and the descriptive variables — but not AVAL yet.
adtte <- derive_param_tte(
  dataset_adsl = adsl,
  start_date = TRTSDT,
  event_conditions  = list(ttae),
  censor_conditions = list(eot),
  source_datasets = list(
    adsl = adsl,
    ae   = filter(adae, TRTEMFL == "Y")   # only treatment-emergent AEs
  ),
  set_values_to = exprs(PARAMCD = "TTAE", PARAM = "Time to First Adverse Event")
)

adtte %>%
  select(USUBJID, PARAMCD, STARTDT, ADT, CNSR, EVNTDESC) %>%
  head(5)
# A tibble: 5 × 6
USUBJID PARAMCD STARTDT ADT CNSR EVNTDESC
<chr> <chr> <date> <date> <int> <chr>
1 01-701-1015 TTAE 2014-01-02 2014-01-03 0 ADVERSE EVENT
2 01-701-1023 TTAE 2012-08-05 2012-08-07 0 ADVERSE EVENT
3 01-701-1028 TTAE 2013-07-19 2013-07-21 0 ADVERSE EVENT
4 01-701-1033 TTAE 2014-03-18 2014-04-30 1 END OF TREATMENT
5 01-701-1034 TTAE 2014-07-01 2014-08-27 0 ADVERSE EVENT One row per subject, each tagged TTAE. STARTDT is first dose, ADT is either the first-AE date (CNSR = 0) or the end-of-treatment censor date (CNSR = 1), and EVNTDESC records which. The clock start and stop are set — what is missing is the elapsed time itself.
Compute AVAL and add covariates
AVAL is the duration from STARTDT to ADT. Do not subtract dates by hand — admiral’s derive_vars_duration() does it with the correct unit and sign. Then derive_vars_merged() brings treatment and covariates back from ADSL so the dataset is ready to analyze and to split by group.
adtte <- adtte %>%
  # AVAL = time from STARTDT to ADT, in days
  derive_vars_duration(
    new_var = AVAL,
    start_date = STARTDT,
    end_date = ADT,
    out_unit = "days"
  ) %>%
  mutate(AVALU = "DAYS") %>%
  # bring treatment + covariates from ADSL for analysis
  derive_vars_merged(
    dataset_add = adsl,
    new_vars = exprs(TRT01A, AGE, SEX),
    by_vars = exprs(STUDYID, USUBJID)
  )

adtte %>%
  select(USUBJID, PARAMCD, AVAL, AVALU, CNSR, TRT01A) %>%
  head(5)
# A tibble: 5 × 6
USUBJID PARAMCD AVAL AVALU CNSR TRT01A
<chr> <chr> <dbl> <chr> <int> <chr>
1 01-701-1015 TTAE 2 DAYS 0 Placebo
2 01-701-1023 TTAE 3 DAYS 0 Placebo
3 01-701-1028 TTAE 3 DAYS 0 Xanomeline High Dose
4 01-701-1033 TTAE 44 DAYS 1 Xanomeline Low Dose
5 01-701-1034 TTAE 58 DAYS 0 Xanomeline High DoseThat is a conformant ADTTE: PARAMCD/PARAM name the endpoint, AVAL/AVALU give the time and its unit, CNSR flags event-versus-censor, and the traceability and treatment variables are attached. Before analyzing, read the dataset back to yourself.
# event vs censored counts
adtte %>%
  count(CNSR) %>%
  mutate(meaning = if_else(CNSR == 0, "Event (had an AE)", "Censored (no AE)"))
# A tibble: 2 × 3
CNSR n meaning
<int> <int> <chr>
1 0 217 Event (had an AE)
2 1 35 Censored (no AE) # time-to-event distribution, overall
summary(adtte$AVAL) Min. 1st Qu. Median Mean 3rd Qu. Max.
1.00 10.75 22.00 42.36 47.25 218.00 The split is the first sanity check: most subjects have an event, a minority are censored. If every subject were censored, or AVAL held a wild value, the event or censor definition would be wrong — catch it here, not in the Kaplan-Meier curve.
Analyze: Kaplan-Meier, median, and the log-rank test
This is the survival-authority payoff. Because ADTTE was built for time-to-event analysis, the dataset drops straight into the survival package — the only adjustment is flipping CNSR to the standard event status with 1 - CNSR. We compare the three treatment arms (dropping screen failures, who were never dosed).
library(survival)

adtte_arms <- adtte %>% filter(TRT01A != "Screen Failure")

fit <- survfit(Surv(AVAL, 1 - CNSR) ~ TRT01A, data = adtte_arms)
fit
Call: survfit(formula = Surv(AVAL, 1 - CNSR) ~ TRT01A, data = adtte_arms)
n events median 0.95LCL 0.95UCL
TRT01A=Placebo 85 65 33 26 60
TRT01A=Xanomeline High Dose 72 68 16 14 23
TRT01A=Xanomeline Low Dose 95 84 18 15 27survfit() prints the median time-to-event per arm with its 95% confidence interval — the median is the day by which half the arm has had the event. The contrast is immediate: the median time to first adverse event is 33 days on placebo versus roughly 16–18 days on the active arms. Subjects on Xanomeline reach their first AE sooner.
Formalize that with a log-rank test, the standard test for “do these survival curves differ?”
survdiff(Surv(AVAL, 1 - CNSR) ~ TRT01A, data = adtte_arms)Call:
survdiff(formula = Surv(AVAL, 1 - CNSR) ~ TRT01A, data = adtte_arms)
N Observed Expected (O-E)^2/E (O-E)^2/V
TRT01A=Placebo 85 65 98.1 11.15 22.3
TRT01A=Xanomeline High Dose 72 68 48.8 7.51 10.2
TRT01A=Xanomeline Low Dose 95 84 70.1 2.76 4.3
Chisq= 23.4 on 2 degrees of freedom, p= 8e-06 The log-rank statistic is large and p is well below 0.001, so the difference between arms is highly unlikely under the null of identical curves. Read it plainly: time to first adverse event differs significantly across the three arms, with placebo subjects staying adverse-event-free the longest — a sensible safety read-out for an active drug.
Now the figure a clinical report ships, built with ggsurvfit for a publication-grade curve with a risk table and the log-rank p on the plot.
library(ggsurvfit)

survfit2(Surv(AVAL, 1 - CNSR) ~ TRT01A, data = adtte_arms) %>%
  ggsurvfit(linewidth = 0.9) +
  add_confidence_interval() +
  add_risktable(risktable_stats = "n.risk") +
  add_pvalue("annotation", size = 4) +
  scale_color_manual(values = c("#3a86d4", "#e07b39", "#5fa052")) +
  scale_fill_manual(values  = c("#3a86d4", "#e07b39", "#5fa052")) +
  labs(
    x = "Days from first dose",
    y = "Probability of being adverse-event-free"
  ) +
  theme_minimal()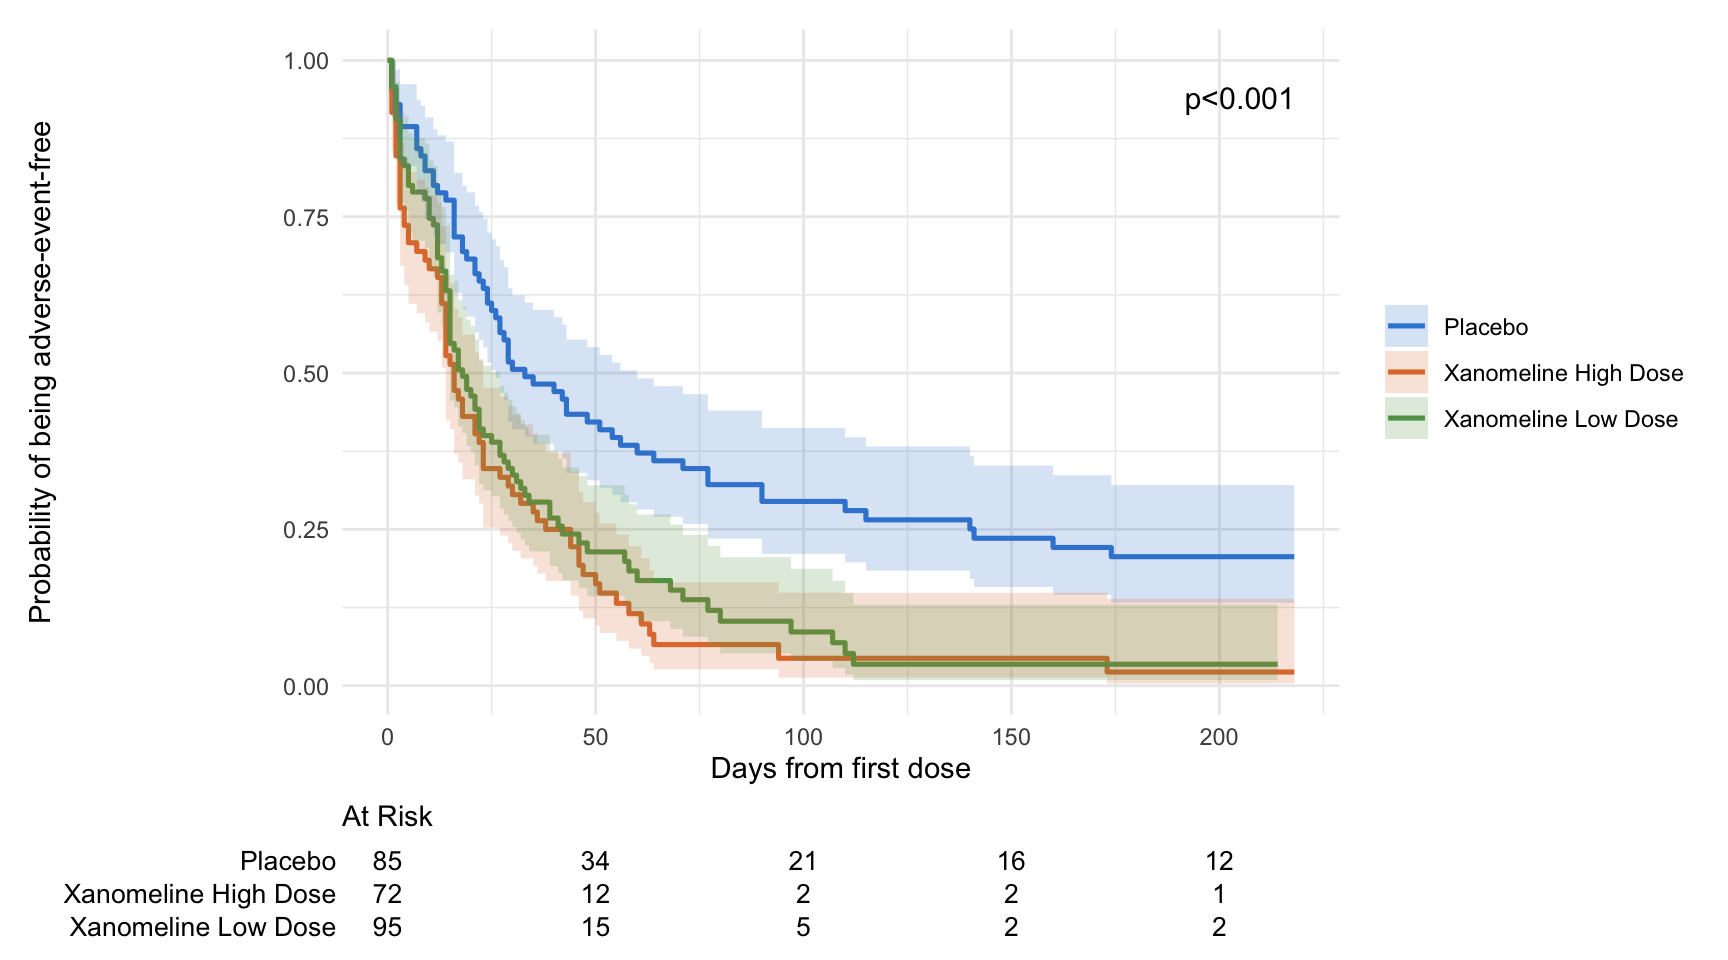
The curve carries everything a reviewer needs: the step functions with confidence bands, the at-risk counts beneath, and the log-rank p on the panel. For the deeper survival methods — building the curve by hand, the log-rank mechanics, Cox models, and polishing the figure — the biostatistics pillar’s Kaplan-Meier estimation, log-rank test, and Cox proportional hazards lessons go all the way down. Here the point is upstream: a correctly derived ADTTE is what makes that analysis a two-line call.
Report
In this analysis of the CDISC pilot data, time to first treatment-emergent adverse event differed significantly across treatment arms (log-rank p < 0.001). Median time to first adverse event was 33 days (95% CI: 26–60) on placebo, versus 16 days (95% CI: 14–23) and 18 days (95% CI: 15–27) on Xanomeline high and low dose, respectively.
That sentence — estimate, interval, test, direction — is the kind of statement that lands in a clinical study report, produced from a dataset you can hand to a reviewer with full traceability back to the raw AE records.
The same recipe builds overall survival
Nothing above is specific to adverse events. Overall survival (OS) is the same derive_param_tte() call with a different event and censor: the event is death, the censor is the last date the subject was known alive. ADSL already carries DTHFL/DTHDT (death) and LSTALVDT (last known alive), so OS needs no AE preparation at all.
death <- event_source(
  dataset_name = "adsl",
  filter = DTHFL == "Y",
  date = DTHDT,
  set_values_to = exprs(EVNTDESC = "DEATH", SRCDOM = "ADSL", SRCVAR = "DTHDT")
)
lstalv <- censor_source(
  dataset_name = "adsl",
  date = LSTALVDT,
  set_values_to = exprs(EVNTDESC = "LAST KNOWN ALIVE DATE", SRCDOM = "ADSL", SRCVAR = "LSTALVDT")
)

adtte_os <- derive_param_tte(
  dataset_adsl = adsl,
  source_datasets = list(adsl = adsl),
  start_date = TRTSDT,
  event_conditions  = list(death),
  censor_conditions = list(lstalv),
  set_values_to = exprs(PARAMCD = "OS", PARAM = "Overall Survival")
) %>%
  derive_vars_duration(new_var = AVAL, start_date = STARTDT, end_date = ADT, out_unit = "days")

adtte_os %>%
  count(CNSR) %>%
  mutate(meaning = if_else(CNSR == 0, "Death", "Censored (alive)"))
# A tibble: 2 × 3
CNSR n meaning
<int> <int> <chr>
1 0 3 Death
2 1 251 Censored (alive)Same structure, same code shape — only the clinical definition changed. Progression-free survival extends it once more: two event sources (progression or death) and a censor at the last tumor assessment, all passed as lists to the same function. That composability is the reason admiral derivations stay readable as endpoints get complex.
One honest note about this example dataset: the CDISC pilot is a low-mortality study, so its OS has only a handful of deaths and its Kaplan-Meier curve is nearly flat — fine for showing the derivation, but not an informative curve. That is exactly why this lesson analyzes time to first adverse event, which has the events needed for an interpretable survival comparison. Choosing an endpoint with enough events is part of the job.
🟢 With an AI agent
Ask Prova “how do I change my ADTTE derivation from time to first adverse event to progression-free survival, with progression or death as the event?” — it answers grounded in this pillar’s lessons, with runnable admiral code you can try on the example pharmaverse data. The runtime is the judge. Ask Prova →
Common issues
Your Kaplan-Meier curve is upside-down (it rises instead of falls). You passed CNSR directly as the event status. The survival package wants 1 = event, but ADTTE’s CNSR is 0 = event. Always use Surv(AVAL, 1 - CNSR), which flips the convention. If the curve climbs toward 1.0, this is almost always the cause.
Every subject comes out censored (CNSR = 1). The event source matched nothing. The usual culprits: the event dataset was filtered to empty before it reached source_datasets (e.g. TRTEMFL == "Y" removed everything because the flag was built wrong), the date variable in event_source() is still NA (a partial date that derive_vars_dt() did not impute), or the dataset_name string in the source does not match a name in source_datasets. Check that the filtered event dataset actually has rows, and that its date column is a real Date.
AVAL looks off by one, or is negative. AVAL is a duration from STARTDT to ADT, so a negative value means an event date precedes the clock start — usually an AE recorded before first dose that should have been excluded by the treatment-emergent flag. admiral counts the duration inclusively; sponsors differ on the “+1 day” convention, so confirm AVAL against your statistical analysis plan rather than assuming a default.
Frequently asked questions
NoteWhat is the ADTTE dataset in CDISC ADaM?
ADTTE is the time-to-event analysis dataset in the ADaM standard — the dataset behind survival endpoints such as overall survival, progression-free survival, and time to first adverse event. It uses the Basic Data Structure (BDS), one row per subject per parameter, and stores the time in AVAL, the censoring flag in CNSR, and the origin and analysis dates in STARTDT and ADT.
NoteWhat does CNSR = 0 versus CNSR = 1 mean in ADTTE?
CNSR = 0 means the event occurred (e.g. death, progression, the adverse event); a positive integer means the subject was censored — followed for some time without the event. This is the CDISC convention, which admiral enforces. It is the opposite of the survival package’s “1 = event” status, which is why analysis code uses Surv(AVAL, 1 - CNSR).
NoteHow do I create ADTTE in R with admiral?
Start from a pre-built ADSL, declare the event and censor with event_source() and censor_source(), then call derive_param_tte() to get one row per subject with STARTDT, ADT, and CNSR. Add the time with derive_vars_duration() (which fills AVAL) and merge treatment and covariates back from ADSL with derive_vars_merged(). The full sequence is worked through above.
NoteWhat is the difference between AVAL, STARTDT, and ADT?
STARTDT and ADT are dates — the clock’s start (often first dose) and its stop (the event date, or the censoring date when no event occurs). AVAL is the duration between them, a number in the unit AVALU (typically days). You derive AVAL from the two dates with derive_vars_duration(); you never store a date in AVAL.
NoteCan I run a Kaplan-Meier analysis directly on ADTTE?
Yes — that is what ADTTE is built for. Pass Surv(AVAL, 1 - CNSR) to survfit() for the curve and median survival, and to survdiff() for the log-rank test. The 1 - CNSR converts ADTTE’s CNSR = 0 event convention to the event status the survival package expects. Plotting libraries such as ggsurvfit and survminer take the same Surv() object.
NoteWhy use admiral’s derive_param_tte() instead of writing the date logic by hand?
derive_param_tte() resolves the “earliest event, else latest censor” logic for you, enforces the CNSR convention, handles multiple event and censor sources composably (e.g. progression or death for PFS), and writes the traceability variables (EVNTDESC, SRCDOM, SRCVAR) a reviewer needs. Hand-rolled case_when() date logic is easy to get subtly wrong and hard to audit — admiral makes the derivation declarative and standard.
Test your understanding
ImportantYour turn: derive a “time to first serious adverse event” parameter
Using the adsl and adae objects built in this lesson, derive an ADTTE parameter for time to first serious adverse event (PARAMCD = "TTSAE"). Serious AEs are flagged by AESER == "Y" in the AE data. Compute AVAL, then count events versus censored.
TipHint
You only need to change the event source: add a filter = AESER == "Y" to event_source() so it matches serious AEs only. Reuse the same end-of-treatment censor_source(), the same derive_param_tte() call (with a new PARAMCD/PARAM), and the same derive_vars_duration().
TipSolution
ttsae <- event_source(
  dataset_name = "ae",
  filter = AESER == "Y",            # serious AEs only
  date = ASTDT,
  order = exprs(AESEQ),
  set_values_to = exprs(EVNTDESC = "SERIOUS ADVERSE EVENT", SRCDOM = "ADAE", SRCVAR = "ASTDT")
)

eot <- censor_source(
  dataset_name = "adsl",
  date = TRTEDT + days(30),
  set_values_to = exprs(EVNTDESC = "END OF TREATMENT", SRCDOM = "ADSL", SRCVAR = "TRTEDT")
)

adtte_sae <- derive_param_tte(
  dataset_adsl = adsl,
  start_date = TRTSDT,
  event_conditions  = list(ttsae),
  censor_conditions = list(eot),
  source_datasets = list(adsl = adsl, ae = filter(adae, TRTEMFL == "Y")),
  set_values_to = exprs(PARAMCD = "TTSAE", PARAM = "Time to First Serious Adverse Event")
) %>%
  derive_vars_duration(new_var = AVAL, start_date = STARTDT, end_date = ADT, out_unit = "days")

adtte_sae %>%
  count(CNSR) %>%
  mutate(meaning = if_else(CNSR == 0, "Serious AE", "Censored"))
Serious AEs are rarer than AEs overall, so expect far more censored subjects (CNSR = 1) than in the all-AE parameter — a good reminder that the event definition drives the event rate.
NoteQuick check: which Surv() call analyzes ADTTE correctly?
A. Surv(AVAL, CNSR) B. Surv(AVAL, 1 - CNSR) C. Surv(CNSR, AVAL)
TipShow answer
B. ADTTE uses CNSR = 0 for an event, but Surv() expects 1 = event, so you flip it with 1 - CNSR. A inverts every subject’s status (events become censors), which turns the Kaplan-Meier curve upside-down. C swaps the time and the status arguments entirely.
Conclusion
ADTTE looks intimidating until you see it as three decisions encoded as data: when the clock starts (STARTDT), what stops it (an event with CNSR = 0, or a censor with CNSR > 0 at ADT), and how long that took (AVAL). admiral turns those decisions into a declarative derivation — event_source(), censor_source(), derive_param_tte(), derive_vars_duration() — that is readable, traceable, and easy to extend from time-to-first-AE to overall survival to progression-free survival. And because the dataset is purpose-built, the survival analysis on top is a two-line call: Surv(AVAL, 1 - CNSR) into survfit() and you have a Kaplan-Meier curve, a median, and a log-rank test. Build the dataset right, and the analysis takes care of itself.
Note
This lesson is reproducible: every result on this page was produced by the code shown — copy any block and run it to reproduce them. The runtime is the judge.
Reuse
Citation
BibTeX citation:
@online{2026,
  author = {},
  title = {ADTTE: {Build} the {Time-to-Event} {ADaM} {Dataset} in {R}
    with Admiral},
  date = {2026-06-30},
  url = {https://www.datanovia.com/learn/pharma-clinical/03-adam-admiral/adtte-time-to-event},
  langid = {en}
}
For attribution, please cite this work as:
“ADTTE: Build the Time-to-Event ADaM Dataset in R with
Admiral.” 2026. June 30. https://www.datanovia.com/learn/pharma-clinical/03-adam-admiral/adtte-time-to-event.